Operations | Monitoring | ITSM | DevOps | Cloud
Monitoring
The latest News and Information on Monitoring for Websites, Applications, APIs, Infrastructure, and other technologies.
Observability Architecture: Components, Stakeholders, and Tools Explained
How to to filter trace spans in Grafana 10.1
How AI is Changing Modern Networking
Grafana 10.1: TraceQL query results streaming
The Plan for InfluxDB 3.0 Open Source
The commercial version of InfluxDB 3.0 is a distributed, scalable time series database built for real-time analytic workloads. It supports infinite cardinality, SQL and InfluxQL as native query languages, and manages data efficiently in object storage as Apache Parquet files. It delivers significant gains in ingest efficiency, scalability, data compression, storage costs, and query performance on higher cardinality data.
Introducing agentless monitoring for Prometheus in Grafana Cloud
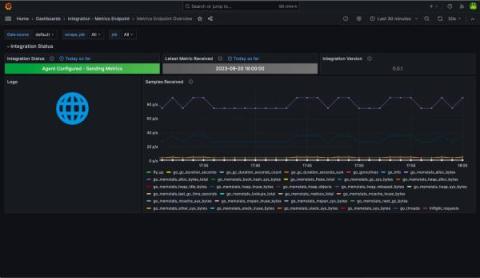
We’re excited to announce the Metrics Endpoint integration, our agentless solution for bringing your Prometheus metrics into Grafana Cloud from any compatible endpoint on the internet. Grafana Cloud solutions provide a seamless observability experience for your infrastructure. Engineers get out-of-the-box dashboards, rules, and alerts they can use to visualize what is important and get notified when things need attention.
Auto-Instrumenting Node.js with OpenTelemetry & Jaeger
Six months ago I attempted to get OpenTelemetry (OTEL) metrics working in JavaScript, and after a couple of days of getting absolutely no-where, I gave up. But here I am, back for more punishment... but this time I found success! In this article I demonstrate how to instrument a Node.js application for traces using OpenTelemetry and to export the resulting spans to Jaeger. For simplicity, I'm going to export directly to Jaeger (not via the OpenTelemetry Collector).
Take Your Service Management Beyond IT
Auto-Creating Defects from BugSplat in Your Defect Tracker
At BugSplat, we're always looking for ways to seamlessly integrate critical crash data into the support workflow. Another step in that quest has just been launched - the ability to automatically create defects from BugSplat databases in attached third-party trackers like Jira, Github Issues, Azure DevOps and more. This isn't just a new feature - it's a game-changer. Here's why.


