Operations | Monitoring | ITSM | DevOps | Cloud

Monitoring

The latest News and Information on Monitoring for Websites, Applications, APIs, Infrastructure, and other technologies.

Triangulate: Add Logs to Your Monitoring Mix

For many IT organizations, triaging or troubleshooting starts with assessing symptoms. As practitioners investigate the causal factors by answering each of the “5 whys,” logs are often where the actual root cause answers lie. This is even more true for issues related to configuration changes, change management, and security. However, diving into log data can be overwhelming as a first step due to the high volume and velocity of logs and missing context.

How to deploy a Hello World web app with Elastic Observability on AWS App Runner

Elastic Observability is the premiere tool to provide visibility into web apps running in your environment. AWS App Runner is the serverless platform of choice to run your web apps that need to scale up and down massively to meet demand or minimize costs. Elastic Observability combined with AWS App Runner is the perfect solution for developers to deploy web apps that are auto-scaled with fully observable operations, in a way that’s straightforward to implement and manage.

Query 3rd Party API Datasets in Real Time with Cribl Search

In today’s world of relentless data growth, security-relevant logs represent a small snapshot of an organization’s overall environment. Teams are beset with a variety of data types, including performance metrics and traces, asset configuration and state, audit logs, and much more. On top of that, teams are expected to scan all of this to compare against industry best practices and join this data with logs and metrics for added context.

When and How to Use Aggregators

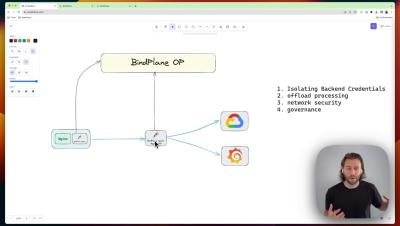
There's lots of great reasons to run OTel agents as aggregator / gateway collectors. In this video we discuss 4 of the most common! About ObservIQ: observIQ brings clarity and control to our customer's existing observability chaos. How? Through an observability pipeline: a fast, powerful and intuitive orchestration engine built for the modern observability team. Our product is designed to help teams significantly reduce cost, simplify collection, and standardize their observability data.

Why Does Observability Need OTel?

To successfully observe modern digital platforms, a new data collection approach was needed. And OpenTelemetry (OTel) was the answer - an industry-agreed open standard - not a single vendor's approach - on how observability (O11y) data should be collected from a platform. This separates out data collection from the vendors’ platform of data processing and visualisation, making the data collecting approach vendor agnostic.

Announcing Splunk Federated Search for Amazon S3 Now Generally Available in Splunk Cloud Platform

Splunk is pleased to announce the general availability of Federated Search for Amazon S3, a new capability that allows customers to search data from their Amazon S3 buckets directly from Splunk Cloud Platform without the need to ingest it. Enterprises rely heavily on cloud object storage services as the de facto destination for their new data to leverage the cost, compliance, security, scalability and manageability benefits that cloud platforms can offer.

Best practices for creating custom detection rules with Datadog Cloud SIEM

In Part 1 of this series, we talked about some challenges with building sufficient coverage for detecting security threats. We also discussed how telemetry sources like logs are invaluable for detecting potential threats to your environment because they provide crucial details about who is accessing service resources, why they are accessing them, and whether any changes have been made.

Our uptime check can now verify the absence of a string

The most popular check that Oh Dear offers is, without a doubt, our uptime check. It's enabled for almost every site we monitor. By default, this check will notify you when your site returns a non-2xx response, but you can greatly customize that behavior. You can check if the response has certain headers, if the response contains a particular string, and more! Some of our users requested a new behavior: checking the absence of a string on the response.

How to deploy Grafana on Kubernetes (Grafana Office Hours #13)

Senior Developer Advocates Nicole van der Hoeven and Usman Ahmad talk about how to deploy Grafana on Kubernetes for beginners: what Kubernetes is, how it's an evolution of distributed computing, what its relationship to Docker is, other things you might need to know to work with Kubernetes, and how you can deploy Grafana on your own Kubernetes clusters.