Operations | Monitoring | ITSM | DevOps | Cloud

Monitoring

The latest News and Information on Monitoring for Websites, Applications, APIs, Infrastructure, and other technologies.

Announcing Sensu 2.0 Beta

We’re excited to announce that Sensu 2.0 Beta is now publicly available for testing! Sensu 2.0 is easier to install and operate, requiring only a single sensu-backend process and sensu-agent process that communicate directly with each other. Our new API-driven approach gives you more flexibility when integrating Sensu into your existing infrastructure and tools. We believe this newest release is built to scale and meet the needs not only of your infrastructure today, but for years to come.

Empowering Help Desk Professionals to Proactively Solve End User Problems

Help desk technicians form the front line of support in identifying, troubleshooting, and preventing end user performance issues (and costly downtime) for key applications and services. They need to quickly identify the scope of the issue and route the critical details required to fix the issue – fast. Goliath Technologies increases the troubleshooting and remediation abilities of help desk technicians by placing a vast array of tools at their fingertips.

We've come a long way together ... Icinga turns 9

Born to be wild. We’ve been busy with bringing Elasticstack integration into full shape with the Icinga 2 feature and the corresponding Icinga Web 2 module. Both of them were thankfully funded and sponsored by VW. Elasticsearch 6 support is sponsored by a customer too, this will hit 2.9 later in June. Earlier in 2017 we’ve also released the Logstash output for Icinga.

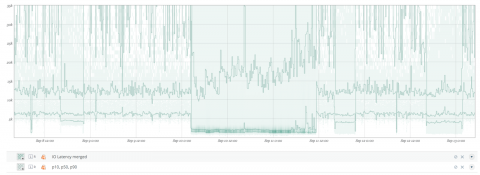
Effective Management of High Volume Numeric Data with Histograms

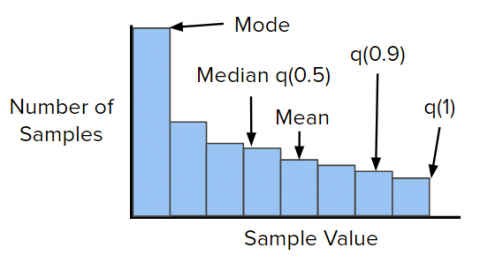
How do you capture and organize billions of measurements per second such that you can answer a rich set of queries effectively (percentiles, counts below X, aggregations across streams), and you don’t blow through your AWS budget in minutes? To effectively manage billions of data points, your system has to be both performant and scalable. How do you accomplish that? Not only do your algorithms have to be on point, but your implementation of them has to be efficient.

How We Used Jaeger and Prometheus to Deliver Lightning-Fast User Queries - Bryan Boreham

This talk comes from practical experience of running a cloud-based SAAS under Kubernetes for the last two years. Prometheus is good for the big picture view of how things are running, while Jaeger acts like a microscope on the internal workings of your system.

Linux System Monitoring with eBPF

The Linux kernel is an abundant component of modern IT systems. It provides the critical services of hardware abstraction and time-sharing to applications. The classical metrics for monitoring Linux are among the most well known metrics in monitoring: CPU utilization, memory usage, disk utilization, and network throughput. For a while now, Circonus installations have organized, the key system metrics in the form of a USE Dashboard, as a high level overview of the system resources.