Operations | Monitoring | ITSM | DevOps | Cloud

Monitoring

The latest News and Information on Monitoring for Websites, Applications, APIs, Infrastructure, and other technologies.

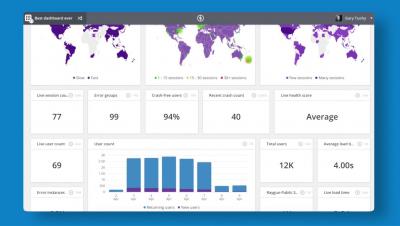
Introducing Dashboard Widgets

This morning we launched a new update for the RapidSpike App. This update includes a totally new Dashboard experience for our users. Our old dashboard – or “Home” screen – featured a number of fairly static graphs and charts showing your account usage. We felt that this screen was badly in need of an update to show off the cool and exciting facts and figures RapidSpike can generate.

Circonus Update: New UI Rollout

The Circonus team is excited to announce the release of our newest update, which includes sweeping changes to the Circonus Monitoring Platform UI. This update is part of an ongoing effort to optimize the Circonus UI for performance and usability on mobile devices, such as phones and tablets, as well as on media PCs, desktops, and laptops, and almost every single change to our familiar UI directly supports that optimization. You’ll find that just about every single page is now responsive.

How Much Downtime is Acceptable?

Downtime occurs. It's an unfortunate fact of online life. No website is able to provide 100% uptime - even tech giants like Google suffer downtime, albeit very occasionally. So, some amount of downtime is inevitable, but how much is acceptable? This question is obviously subjective - downtime that's acceptable for one person may be intolerable for another. Therefore, we undertook a little research...

OpenTracing: Zipkin as Distributed Tracer

In part one of the OpenTracing blog series we provided a good OpenTracing overview, explaining what OpenTracing is and does, how it works and what it aims to achieve. One of the key aspects of OpenTracing is that it is vendor neutral, and also that OpenTracing is just a specification. In order to instrument an application via OpenTracing API, it’s necessary to have an OpenTracing-compatible tracer correctly deployed and listening for incoming span requests.

Skylight Agent 2.0 Released

Today, we released version 2.0 of the Skylight Agent. 2.0 doesn't introduce any new APIs, but we did rewrite the SQL Lexer to support more varieties of queries. We also spent a lot of time on internal refactoring and improved our error logging. Since we follow semantic versioning, we also took the opportunity to drop support for some older dependencies and environments. Read on for more information about upgrading as well as some technical details on our internal changes.

Icinga 2.8.3 released

Today we are releasing a new support version of Icinga 2.8, a small one to pass the time until 2.9. This release includes fixes for the InfluxDB and Elasticsearch features. Please note that Elasticsearch 6 support is coming with 2.9. In addition to the fixes we’ve added support for multiple check parameters for the check_nscp_api plugin and working sysconfig/defaults variables support, you’ll also find many documentation updates.

Raygun's Dashboard: Spot performance problems and get data quickly

Raygun’s software intelligence platform brings you a new way to view and sort your data with a new Dashboard. Raygun is designed to give you a better understanding of your overall software health – from errors and crashes to performance problems affecting your end users. To do this, Raygun gathers a great deal of data about how users are interacting with your application and whether it is performing at its best.