Operations | Monitoring | ITSM | DevOps | Cloud

Monitoring

The latest News and Information on Monitoring for Websites, Applications, APIs, Infrastructure, and other technologies.

New video: How to visualize your traces - tools and new ideas

In microservices, distributed tracing is a method for aggregating all the operations that occur in your distributed systems that were triggered by a specific request. If these traces are visualized, developers can gain insights into how their service behaves when it’s run with other services, which helps them understand why errors occur.

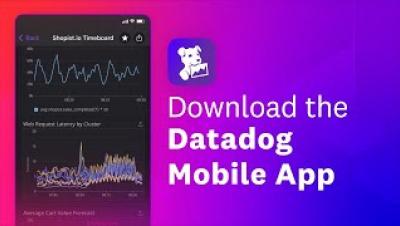
Investigate critical alerts on the go with the Datadog mobile app

The Datadog mobile app provides real-time visibility into critical alerts, incidents, and application performance metrics across your entire environment, helping you troubleshoot directly from your mobile device. On-call engineers can quickly evaluate the conditions that triggered an alert, determine its urgency, and decide the next course of action—anywhere, anytime.

Network Log Archiving = Perfect Backwards Visibility

Network monitoring is ideal for getting a real-time view of your connected environment, and with reports, you can look back in time too. Logs are key to this rear-view mirror look, as they contain all the data for all the elements you are monitoring. But without network log archiving, you can only look back so far. Did you know that according to an IBM/Ponemon study, it takes an average of 287 days to discover and contain a data breach?

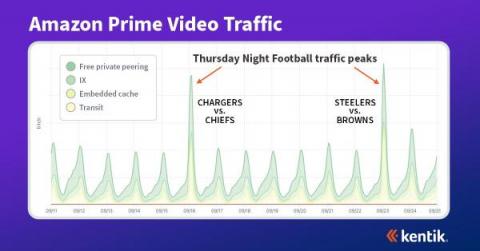
Anatomy of an OTT traffic surge: Thursday Night Football on Amazon Prime Video

This fall Amazon Prime Video became the exclusive broadcaster of the NFL’s Thursday Night Football. This move continued Prime Video’s push into the lucrative world of live sports broadcasting. While they had previously aired TNF, as it is known, this is the first season Amazon Prime Video has exclusive rights to broadcast these games. As you can imagine, airing these games has led to a surge in traffic for this OTT service.

Inside the migration from Consul to memberlist at Grafana Labs

At Grafana Labs we run a lot of distributed databases. These distributed databases all make use of a hash ring in order to evenly distribute workloads across replicas of certain components. For a more detailed description of the architecture of our projects, check out our Mimir architecture docs.

Creating Custom Functions With Tips from InfluxDB University

Flux is InfluxDB’s functional data scripting language. It’s made to query, process, analyze, and act on data. It’s very powerful and is built and optimized for time series. There are so many things you can do with Flux it can be hard to know where to start. This August, InfluxDB University launched a free Intermediate Flux course taught by experts that can take your Flux skills up a notch.

Benefits of Apache web server monitoring tools

Incorporating Apache web server monitoring into your IT infrastructure management strategy can help identify performance bottlenecks preemptively. This proactive monitoring approach provides data necessary to ensure that your web server is up to the task and make optimizations if needed. Guaranteeing your customers a smooth and hassle-free user experience could go a long way into cementing their trust towards your organization.

Optimize your .NET application performance with the Datadog Continuous Profiler

.NET is a framework built by Microsoft that simplifies the complexities of developing cross-platform applications. Using.NET, developers can create powerful applications with rapid response times and more. We’re excited to announce that the Datadog Continuous Profiler now provides general support for.NET applications, including.NET Framework, .NET Core, and.NET 5+.