Operations | Monitoring | ITSM | DevOps | Cloud
Monitoring
The latest News and Information on Monitoring for Websites, Applications, APIs, Infrastructure, and other technologies.
25 AWS Monitoring Tools And Best Practices For 2022
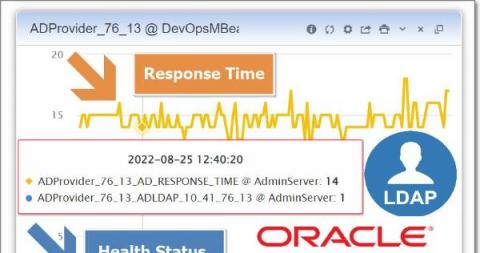
How to Monitor LDAP or Active Directory Security Provider in WebLogic and Oracle FMW Domains?
While performing WebLogic operations, we have many Security Provider definitions. These security provider definitions are either LDAP or Active Directory.
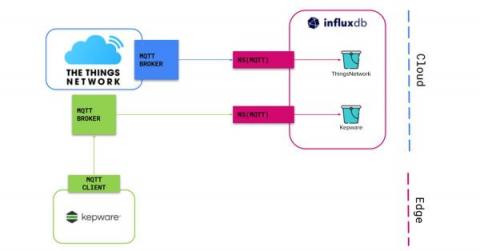
InfluxDB Cloud Native Collectors, Enterprise and Industrial IoT Examples - Part 1
Learn how to deploy InfluxDB Cloud’s Native Collectors with Kepware and The Things Network. Did you hear about the new feature that just dropped to InfluxDB Cloud? Native Collectors! Starting with MQTT. There will be plenty of content to get you started with Native Collectors. So this blog series covers connecting two popular IoT-based platforms to InfluxDB Cloud using native Collectors. One Enterprise use case and one industrial use case.
Introducing Netdata Source Plugin for Grafana: Enhanced high-fidelity troubleshooting data source for the Open Source community!
The open-source community is about to benefit greatly from Netdata’s new Grafana data source plugin, which makes use of a powerful data collection engine. This new plugin maximizes the troubleshooting capabilities of Netdata in Grafana, making them more widely available. Some of the key capabilities provided to you with this plugin include the following.
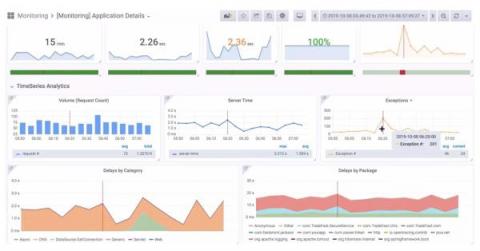
Augmenting APM with InfluxDB for Faster Issue Resolution
An enterprise IT company hosted a large industry event that drew attendees from all around the globe, including key technology leaders. Organizers knew that their IT offerings needed to be top notch to ensure attendees were happy when it came to event experience. The event application allowed attendees to browse and register for sessions at the event. So, organizers needed to be able to identify issues in real-time and fix them quickly.
SignalFlows to SLOs
How are you tracking the long-term operation and health indicators for your micro and macro services? Service Level Indicators (SLIs) and Service Level Objectives (SLOs) are prized (but sometimes “aspirational”) metrics for DevOps teams and ITOps analysts. Today we’ll see how we can leverage SignalFlow to put some SLOs Error Budget tracking together (or easily spin up same with Terraform)!
Honeycomb Announces Major Updates to PagerDuty Integration
Today, we’re announcing major new updates to Honeycomb’s PagerDuty integration. These updates put more of the information you need into PagerDuty notifications and allow for greater configurability. These enhancements are available to all users who leverage Honeycomb Triggers and Burn Alerts to send notifications via PagerDuty.
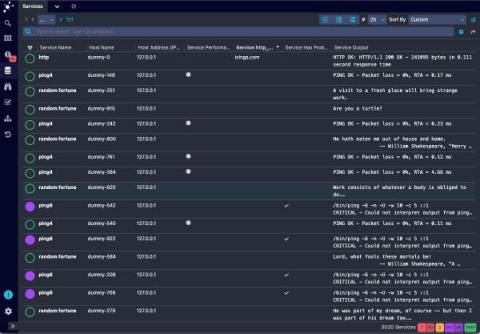
List View in Icinga DB Web
Similar, to the monitoring module in Icinga Web, Icinga DB Web also provides list views for hosts and services to provide the most common columns to reduce the backend query load.
It's time to break up with your old monitoring tools
More organizations are upgrading from siloed infrastructure and application monitoring tools to full-stack observability solutions. That's great — but what if your team can't quit its tried-and-true legacy tools, even when they're unfit for modern apps and infrastructure?


