Operations | Monitoring | ITSM | DevOps | Cloud

The latest News and Information on Monitoring for Websites, Applications, APIs, Infrastructure, and other technologies.

Network Performance Dashboard

In this dashboard tutorial video, we will walk you through building a Network Performance dashboard. This dashboard provides users with the visibility they need into the status of their network performance from their offices down to an individual users device. Obtaining this single pane of glass visibility is made easy with the combination of both CloudReady and Service Watch metrics into dashboards. When utilizing these dashboards, users can quickly identify which networks are performing poorly, allowing them to quickly resolve issues and ensure end users have an optimal experience.

How to Send Grafana Alloy Logs to Grafana Loki | Ask the Experts | Grafana

In this video, Matt Durham, Sr. Software Engineer on the Grafana Alloy team, shows you how to send Grafana Alloy logs to Loki. Specifically, we address the question: "Is it possible to send data from one Grafana Alloy to another? Could anyone supply me with config examples of such interactions? If I send data from Grafana Alloy directly to Loki, it is working. If I send data from Grafana Alloy to another, and then to Loki, the second instance gives me an error.".

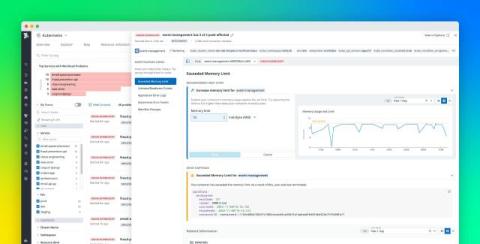
Manage your infrastructure with ServiceNow CMDB and Datadog

ServiceNow is a popular IT service management platform that helps organizations track and manage enterprise-level IT processes, such as on-prem infrastructure management, customer support, and incident response. By using ServiceNow’s configuration management database (CMDB), organizations can easily centralize and manage information about all the IT objects they own in order to track and maintain them more efficiently.

MELT: Understanding Metrics, Events, Logs and Traces for Effective Observability

The infrastructure must be “invisible” to the user, but visible to IT strategists to ensure the performance and service levels required by the business, where observability (as part of SRE or site reliability engineering) is essential to understand the internal state of a system based on its external results. For effective observability, there are four key pillars: metrics, events, logs, and traces, which are summarized in the acronym MELT.

Azure Backup Pricing Guide - How Much Windows' Azure Backup Costs

Most enjoy the peace of mind cloud backups offer for all the damage the costs can do to their wallets. Microsoft Azure offers Azure Backup service to safely backup your data on Microsoft Azure cloud, allowing you to store Azure VMs and even on-premise machines and workloads. But Azure prices can be confusing, and Azure Backup is no different. To best understand how much you’re paying and why you’re paying that much, read on! Source: Azure.

Apdex in Honeycomb

“How is my app performing?” is one of the most common, yet hardest questions to answer. There are myriad ways to measure this, like error rate, average response time, and so on. Enter the Application Performance Index (aka Apdex), a single metric that attempts to answer, “Are my application’s users happy?” Apdex is an open standard that was formalized in 2005 by the Apdex Alliance.

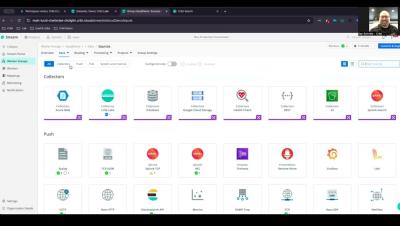
Data Is a Blizzard: Just Because Each Snowflake Is Unique Doesn't Mean Your Search Tools Have to Be Too

Cribl Search is agnostic, allowing administrators to now query Snowflake datasets as they can dozens of other Lakes, Stores, Systems & Platforms. The data that IT and security teams rely on to monitor network operations continues to grow at a 28% CAGR, and it’s stressing many organizations’ ability to analyze all this data effectively. In fact, in some cases, less than 2% of it ever gets looked at.

You don't need ALL those metrics!

Metrics are key to monitoring system health and performance but you probably are ingesting far more metrics than you will ever need or use. The issue is that popular tools in this space, such as OpenTelemetry and Prometheus, leverage node exporters to emit a plethora of metrics. OpenTelemetry tracks even the minutest details of system performance. Prometheus exporters can generate a vast array of metrics, ranging from CPU usage to disk I/O, and everything in between.