Operations | Monitoring | ITSM | DevOps | Cloud

Monitoring

The latest News and Information on Monitoring for Websites, Applications, APIs, Infrastructure, and other technologies.

Why You Need a Centralized Approach to Monitoring

With a standard model for monitoring data across the organization, different teams can use a common infrastructure and extract maximum value from it. Monitoring (also sometimes referred to as observability) involves collecting and analyzing data from a source over time to track its health and/or performance. Because change occurs over time, virtually all monitoring data is time series data, meaning it has a timestamp.

Two sides of the same coin: Uniting testing and monitoring with Synthetic Monitoring

Historically, software development and SRE have worked in silos with different cultural perspectives and priorities. The goal of DevOps is to establish common and complementary practices across software development and operations. Sadly, in some organizations true collaboration is rare and we still have a way to go to build effective DevOps partnerships.

Cribl's Zachary Kilpatrick Awarded 2023 Channel Chief Award from CRN for Second Consecutive Year

The Cribl Partner Program is designed to be a comprehensive solution for organizations looking to grow their customer relationships and revenue streams, while also enabling a fast deployment of observability solutions to serve customers. Our partners receive extensive training, tools, and support to unlock the full potential of observability data for their customers.

In a Toxic Relationship with Your Current Observability Search Tool? There's Other Fish in the Sea

IT tools are similar to romantic relationships. Over time, you tend to fall into the same old dull routines, like Rupert Holme’s song Escape (The Piña Colada Song). That routine — collect dataset, route, ingest ($$) and then search, collect dataset, route, ingest, then search, … this approach is not only breaking your heart but your budget too.

Advanced filtering capabilities, Logs performance benchmark, and front page of HN - SigNal 21

Welcome to our first monthly product newsletter of 2023, SigNal - 21! Last month, we worked closely with our users to ship some advanced features which will enable our users to take advantage of their observability data more effectively. We were also trending on the front page of hacker news and got featured as one of the fastest-growing open source startups. Let’s dive in to see what humans at SigNoz were up to in the month of January 2023.

February 2023: Notifications-only sub-users and 30 seconds monitor interval

As we have previously announced: Notifications-only sub-users are here! After receiving your feedback, we realized that full-featured sub-users may not be the ideal option for everyone. This new feature is ideal for our UptimeRobot users who want to get alerted teammates or clients but don’t want to share access to account or monitors. You can manage your team mates and their access on the Team page. Here you can add / edit / remove seats with write, read, or notify-only access.

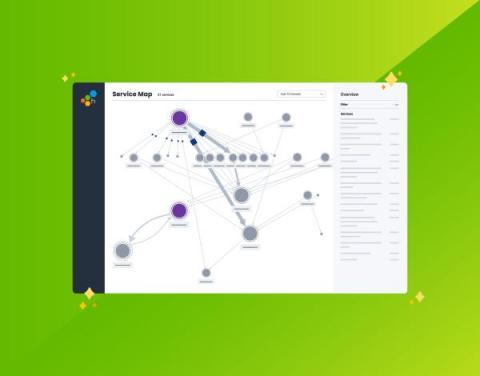
Get the Big Picture: Learn How to Visually Debug Your Systems with Service Map-Now Available in Sandbox

Honeycomb recently announced the launch of Service Map, a new feature that gives users the ability to quickly unravel and make sense of the interconnectivity between services in highly complex and intricate environments.

Dashboard Fridays: Sample Jira Dashboard

These Jira dashboards give a clear overview of your Jira instance and provide more details on the key items over which the engineering team needs oversight, like build status, critical bugs, and costs. Creating Jira dashboards in SquaredUp means Engineering Management doesn’t have the additional work of collating all the detailed Jira data to make sense of it from a high level. It also enables Release Teams to more easily consume data surfaced from all the engineering teams, while still being able to drill into the details of each dashboard as needed.

Release 1.38.0: Dramatic performance and stability improvements, with a smaller agent footprint

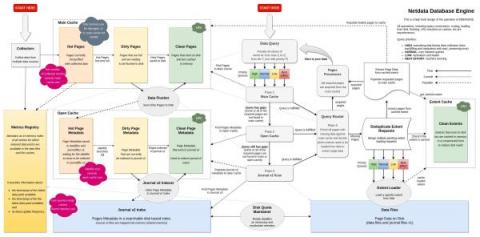
We completely reworked our custom-made, time series database (dbengine), resulting in stunning improvements to performance, scalability, and stability, while at the same time significantly reducing the agent memory requirements. On production-grade hardware (e.g. 48 threads, 32GB ram) Netdata Agent Parents can easily collect 2 million points/second while servicing data queries for 10 million points / second, and running ML training and Health querying 1 million points / second each!