Operations | Monitoring | ITSM | DevOps | Cloud

Monitoring

The latest News and Information on Monitoring for Websites, Applications, APIs, Infrastructure, and other technologies.

Logs vs Metrics: Pros, Cons & When to Use Which

As we at Splunk accelerate our cloud journey, we’re often faced with the decision of when to use logs vs metrics — a decision many in IT face. On the surface, one can do a lot by just observing logs and events. In fact, in the early days of Splunk Cloud, this is exactly how we observed everything. As we continue to grow, however, we find ourselves using a combination of both. This post lays out the overall difference in logs and metrics and when to best utilize each.

An Introduction to AWS Monitoring with Prometheus and Logz.io

Prometheus is a widely utilized time-series database for monitoring the health and performance of AWS infrastructure. With its ecosystem of data collection, storage, alerting, and analysis capabilities, among others, the open source tool set offers a complete package of monitoring solutions. Prometheus is ideal for scraping metrics from cloud-native services, storing the data for analysis, and monitoring the data with alerts.

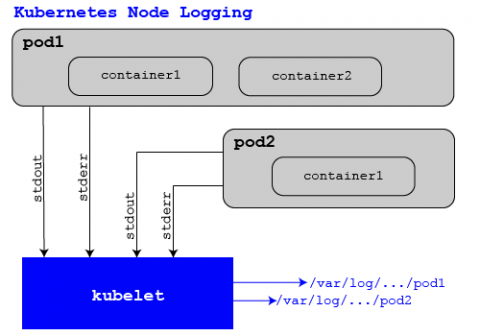
Logging and monitoring Kubernetes

Kubernetes is first and foremost an orchestration engine that has well-defined interfaces that allow for a wide variety of plugins and integrations to make it the industry-leading platform in the battle to run the world's workloads. From machine learning to running the applications a restaurant needs, you can see that just about everything now uses Kubernetes infrastructure. All these workloads, and the Kubernetes operator itself, produce output that is most often in the form of logs.

4 Causes of Website Downtime and How to Monitor Them

A lot of site owners underestimate the consequences of downtime, assuming that a brief outage won’t do much harm to their business. But this can leave them with broken web pages that are either poorly rendered or filled with bugs, frustrating users into hitting the “back” button since they can’t navigate the site. The truth is, keeping outages at bay beats fixing them after the fact, even with a guaranteed backup plan.

NiCE Oracle Management Pack 5.3 released

Oracle is a highly performant and reliable multi-model database management system running online transaction processing, data warehousing, and mixed database workloads. Although Oracle environments are reliable and performant, monitoring dedicated Oracle on-premise or cloud deployments is crucial to safeguard business continuity.

Dashboard Fridays: Sample Kubernetes dashboard

Engineers need to understand the status of microservices run on EKS, like health status of clusters and nodes, to avoid issues impacting business critical microservices. Plus, you need to be able to keep an eye on EKS resources, including whether the Kubernetes cluster has auto-scaled (where enabled). Usually, to view these metrics, it requires looking at each EKS cluster and node group individually in the AWS Console, or via another complex third-party dashboarding tool. The data is siloed and difficult to consolidate.

Get High-Performance, Enterprise-Class Observability With Sensu Go

Sensu offers a complete solution for infrastructure monitoring and observability, designed to give you visibility into all of your important infrastructure components, including containers, applications, traditional server closets, and the cloud. Sensu Go is a commercial product based on an open source core that is freely available under a permissive MIT License and publicly available on GitHub.

Apica Quick Guides - Memu Player Setup for ZebraTester Recording

Have you ever wondered what that one checkbox does, where that button takes you or what a specific function does? These quick guides are designed to explain every function as quick and precise as possible so you can continue your monitoring without any disturbance. This guide assumes you already have your Memu Android Emulator and ZebraTester installed and the intention of this guide is to show you how to setup Memu in order to allow ZebraTester to record the traffic from it.