Operations | Monitoring | ITSM | DevOps | Cloud

Monitoring

The latest News and Information on Monitoring for Websites, Applications, APIs, Infrastructure, and other technologies.

Observability: Working with Metrics, Logs and Traces

The concept of observability centers around collecting data from all parts of the system to provide a unified view of the software at large. Fault tolerance, no single point of failure and redundancy are prominent design principles in modern software systems. But that doesn’t mean errors, degradation, bugs or even the occasional catastrophe don’t happen.

Redis Monitoring | 101 Guide to Redis Metrics Monitoring

Monitoring Redis for performance issues is critical. Redis is famous for its low-latency response while serving a large number of queries. There are certain key metrics that you can monitor to keep track of your Redis instance performance. In this guide, we will go through key Redis metrics that should be monitored and ways to collect these metrics with in-built Redis tools.

Customer-Centric Observability: Experiences, Not Just Metrics

Martin and Jess recently conversed with Todd Gardner of RequestMetrics as part of the O11ycast podcast. We don’t normally write blogs based on these conversations, but there were impactful comments in that episode that bear repeating. You can listen to the full conversation if you wish. Let’s get into it!

Office 365 Monitoring: The Challenges, and What to Do About Them

Office 365 is used by more than one million companies around the world. Business employees count on these apps constantly to do their jobs, whether they’re writing documents, updating spreadsheets, building slides, or checking email. While cloud-based apps like Office 365 offer undeniable advantages for enterprises and business users, they also create tough challenges for IT operations and network operations (NetOps) teams.

6 Key Factors to Consider When Choosing a Website Platform

Choosing the right website platform is an important decision for anyone looking to establish a solid online presence. In fact, choosing the wrong website platform has exposed brands to issues like security breaches, poor mobile responsiveness, and terrible load speeds. To buttress the last point, Google research showed that 32% of users would leave your website if it experiences poor load speed. In other words, they want a good user experience.

Monitoring your Nextjs application using OpenTelemetry

Nextjs is a production-ready React framework for building single-page web applications. It enables you to build fast and user-friendly static websites, as well as web applications using Reactjs. Using OpenTelemetry Nextjs libraries, you can set up end-to-end tracing for your Nextjs applications. Nextjs has its own monitoring feature, but it is only limited to measuring the metrics like core web vitals and real-time analytics of the application.

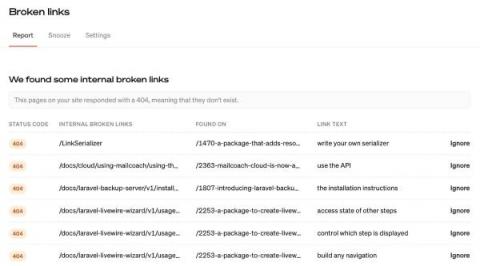
Our broken links check has been improved

One of our unique monitoring features is that we crawl your entire site to discover links that might be broken. When we discover a broken link, we'll send you a notification and display every broken link in our Broken Links Report. We've made a nice quality-of-life improvement to that Broken Links Report. In addition to displaying the broken link URL and the page on which that broken link was found, we now also display the link text of that broken link.

Top 11 MYSQL monitoring tools in 2023 [open-source included]

Database monitoring is a critical component in your application performance monitoring. Apart from application code issues, database issues are one of the most common reasons for a bad user experience. MySQL is one of the most popular open-source DBMS that businesses have widely adopted. MySQL monitoring tools can help you identify potential issues with your database, keep a continuous check on your database instances, improve performance and detect and alert you about real-time issues.