Operations | Monitoring | ITSM | DevOps | Cloud


The latest News and Information on Monitoring for Websites, Applications, APIs, Infrastructure, and other technologies.

BindPlane Agent Resiliency

Anything But Tech Debt
Tech debt is usually one of the most fraught topics on engineering teams. Engineers often feel they aren’t allowed enough time to address tech debt. Product partners wonder why engineers spend so much time working on it—or at least talking about it. “The business” always seems to insinuate that engineers should do less of it, instead focusing on shipping value to customers.

7 OpenTelemetry Metrics to Track for Better Visibility
In today’s rapidly evolving software landscape, ensuring observability is crucial for building robust and reliable applications. One of the critical components of observability is metrics, which provide valuable insights into the performance and behavior of our systems. OpenTelemetry, an open-source observability framework, offers a standardized approach to capturing, exporting, and analyzing metrics. This blog post explores seven OpenTelemetry metrics for tracking better visibility.

New in Grafana 10: Grafana Scenes for building dynamic dashboarding experiences
With Grafana 10, the latest major release of our data visualization platform, we wanted to explore new ways to empower our developer community. Case in point: Grafana Scenes, a new frontend library that enables developers to create dashboard-like experiences — such as querying and transformations, dynamic panel rendering, and time ranges — directly within their Grafana application plugins.

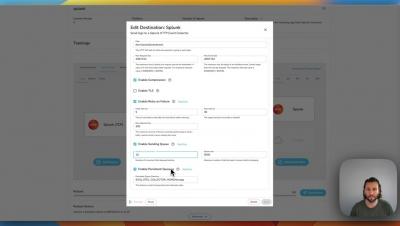
Leveraging Git for Cribl Stream Config: A Backup and Tracking Solution
Having your Cribl Stream instance connected to a remote git repo is a great way to have a backup of the cribl config. It also allows for easy tracking and viewing of all Cribl Stream config changes for improved accountability and auditing. Our Goal: Get Cribl configured with a remote Git repo and also configured with git signed commits. Git signed commits are a way of using cryptography to digitally add a signature to git commits.

Introducing Bits AI, your new DevOps copilot
Business-critical infrastructure and services generate massive volumes of observability data from many disparate sources. It can be challenging to synthesize all this data to gain actionable insights for detecting and remediating issues—particularly in the heat of incident response.

DASH 2023: Guide to Datadog's newest announcements
This year at DASH, we announced new products and features that enable your teams to get complete visibility into their AI ecosystem, utilize LLM for efficient troubleshooting, take full control of petabytes of observability data, optimize cloud costs, and more. With Datadog’s new AI integrations, you can easily monitor every layer of your AI stack. And Bits AI, our new DevOps copilot, helps speed up the detection and resolution of issues across your environment.

Store and analyze high-volume logs efficiently with Flex Logs

Enhance code reliability with Datadog Quality Gates
Maintaining the quality of your code becomes increasingly difficult as your organization grows. Engineering teams need to release code quickly while still finding a way to enforce best practices, catch security vulnerabilities, and prevent flaky tests. To address this challenge, Datadog is pleased to introduce Quality Gates, a feature that automatically halts code merges when they fail to satisfy your configured quality checks.