Operations | Monitoring | ITSM | DevOps | Cloud

The latest News and Information on Log Management, Log Analytics and related technologies.

Making the Collection of Centralised S3 Logs into Splunk easy with Lambda and SQS

Got multiple AWS data sources in the same S3 bucket but struggle with efficient SNS notifications based on prefix wildcards? Well, struggle no more, we’ve got your back. Many of our customers have a centralised S3 Bucket for log collection for multiple sources and accounts. For example, all Config, CloudTrail and Access Log logs may be routed into one central bucket for an organisation.

Why the CEO Cares About Splunk

Evolving business themes come at us in waves. So far this millennium we have had The New Economy, The Cloud, and now Digital Transformation. Underpinning these themes are real, economically significant dynamics that drown out the bleating voices of pundits and cynics alike. The Internet is not a bubble, the cloud is not a fad, and digital transformation is, well, transformative. Let’s take a look at what that last one means for Financial Services.

Reduce Monitoring Costs: How to Identify and Filter Unneeded Telemetry Data

To understand what’s going on in their environment, DevOps teams usually ship some combination of logs, metrics and traces—depending on which signals they’re hoping to monitor. Each data type will expose different information about what is happening in a system. However, not all of that information will be helpful on a day-to-day basis, which can rack up unnecessary data storage costs. That should require users start to filter telemetry data across their observability stacks.

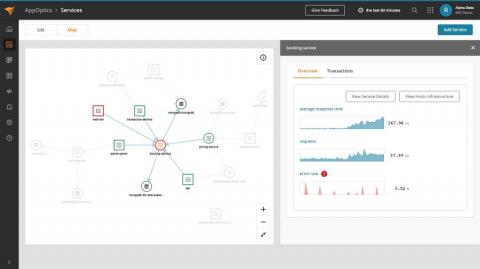
SolarWinds Updates APM Suite Designed to Simplify Application and Infrastructure Management

Introduces new service map and web transaction recorder, enhanced custom parsing rules, and search user experience to further reduce application performance management complexity and speed up troubleshooting.

How to categorize logs for more effective monitoring

Logs provide a wealth of information that is invaluable for use cases like root cause analysis and audits. However, you typically don’t need to view the granular details of every log, particularly in dynamic environments that generate large volumes of them. Instead, it’s generally more useful to perform analytics on your logs in aggregate.

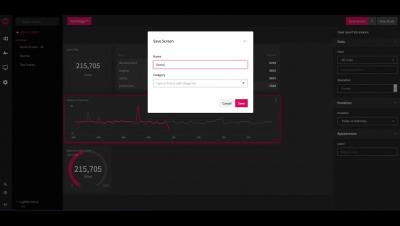
LogDNA | How to Create Screens

The Screens feature displays a series of widgets to share across an organization. Widgets can display log activity, from the number of logs ingested in the last 4 hours, to a line graph comparing today’s to yesterday’s log ingestion. Control the data displayed by customizing a “Screen” with a combination of different widgets, providing your organization with a snapshot of the system’s activity.