Operations | Monitoring | ITSM | DevOps | Cloud

Latest Videos

Using CLI To Configure Codefresh And Create And Manage Kubernetes Pipelines

Have you tried using Codefresh CLI to configure and operate Codefresh? UIs are great as a learning experience, but using them is slow, prone to errors, hard to reproduce, and results in hard-to-document processes. Writing code and scripts to accomplish the same results is a sign of maturity and experience. It is proof that we are capable of working in a team while also being an expert. Let's see how we can use everything-as-code and CLI to configure, create, and observe a fully operational Kubernetes pipeline in Codefresh.

Modern Monitoring

"Observability" - don't roll your eyes just yet. As application architectures change, and the relationship between applications and the infrastructure they run on is blurred, tech-enabled enterprises have to consider new practices for supporting them. Observability gives us an opportunity to embrace the new set of challenges and offer better approaches and strategies. In this episode, we talk about how the complexity of modern apps impacts the changes needed on the management plane.

Percepio DevAlert - IoT Device Monitoring and Diagnostics (brief summary)

People often have problems with IoT devices due to software issues, and the developers are largely unaware. What if IoT device developers could be notified about real-world issues in IoT devices automatically and get detailed diagnostics on the very first occurrence? This is provided by Percepio DevAlert, a novel cloud service that gives real-world feedback about issues in the device software, that allows for rapid continuous improvement and for embracing DevOps in IoT device development. Learn from real-world usage and make a great product that beats the competition.

Automating IT Management | Netreo On-Demand Webinars

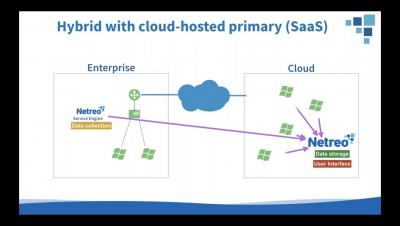
In this webinar, you’ll explore real world examples the easiest ways to automate your IT management and processes. We’ll also show you the state of the art in remote and on-premise management, and how to achieve a comprehensive single view into your entire IT environment – without a huge administrative burden. You’ll also learn the best ways to manage proactively and get ahead of problems before they affect users, instead of spending all your time firefighting.

Introducing Netreo Version 12 | Netreo On-Demand Webinars

Today’s IT organizations are faced with the challenge of integrating new technology into their infrastructure while continuing to support all of their legacy needs. Building upon the host of features already present in our flagship product, we’re proud to announce the release of Netreo v12. The enhancements found in this latest release greatly furthers an administrator’s ability to get deep insight into resources across their entire IT landscape.

Managing IT at Scale | Netreo On-Demand Webinars

Every IT environment faces the challenge of scaling operations efficiently and seamlessly, even as the demands of the business change and complexity increases. Maintaining visibility while preserving security and enabling rapid NOC response can be a difficult challenge to solve. View this webinar to learn the best ways to leverage distributed collection and monitoring to seamlessly manage your global IT operations, get better visibility into secure network segments and datacenters, and improve your service-levels, all without adding additional labor burden.

LogicTalks - How Logicalis Intelligently Monitors and Services it's Global Customer Base

In this episode of LogicTalks, Mark Banfield, Chief Revenue Officer at LogicMonitor, sits down with Justin Cawood, Director of International Managed Services Operations at Logicalis Group, to discuss how Logicalis, a managed services provider, has evolved the way they monitor their customer's infrastructures around the globe with LogicMonitor. Justin explains how LogicMonitor has allowed them to quickly discover and onboard new clients and infrastructures, consolidate tools and learnings across the global organization, and help Logicalis' customers to transition to cloud and hybrid environments and excel while working from home.

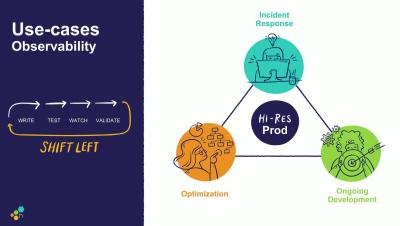
New Product Updates What Does it Mean to Observe and Debug in 'Hi Res'

A number of Honeycomb features have been released throughout spring 2019 that, collectively, we like to say deliver “hi-res” across the Engineering and DevOps lifecycle. What do we mean? First, hi-res with Honeycomb means you get clearer visibility about how your production is behaving in real time, as you release new code. Secondly, it means once you have those insights (thanks to granular event data stored in Honeycomb), you can debug and resolve more efficiently. So, how do we do it?