Operations | Monitoring | ITSM | DevOps | Cloud
The Ransomware Pandemic | Security Insights Podcast: Ep. 2
This latest ransomware pandemic is infecting end users and security teams alike, exploiting old vulnerabilities and forcing new risk management strategies. Chief Security Officer Phil Richards reviews how organizations can avoid and remediate ransomware cyber attacks, including: Ivanti finds, heals, and protects every device, everywhere – automatically. Whether your team is down the hall or spread around the globe, Ivanti makes it easy and secure for them to do what they do best.
That's My Slice!
Learn more about network slicing in this presentation by Hayim Porat at Mobile World Congress 2023. #5G #MWC
Platform Engineering Is the Future of Ops
Ops and DevOps roles as we know them are on their way to becoming extinct—the future is platform engineering. While DevOps engineers typically focus on the application layer, platform engineers focus on the underlying infrastructure layer. Without a solid and reliable platform, it can be challenging to deploy and maintain software applications effectively. This can result in downtime, poor performance, and security vulnerabilities. Platform engineering enables software applications and services to run effectively and efficiently and has a direct impact on the user experience and the success of the entire organization.
Splunk Data Insider: What is Edge Computing?
As cloud computing is pushed to its limits by the exponential growth of data, adopting edge will be the logical next step for enterprises and other organizations that can’t afford latency. For that and many other reasons, edge computing is here to stay. And it will be the key we need to not just unlock value from data, but also stay afloat during this epoch.
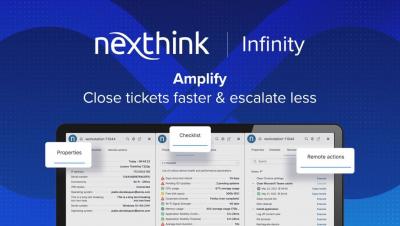
Accelerate Digital Transformation with Nexthink
70% of digital transformation projects fail because employees don’t adopt the new tools. Nexthink Infinity provides the insight and engagement you need to drive employee adoption for successful transformation.
Create a streaming dataset for Apache Kafka with Docker
Experiencing Apache Kafka without a streaming dataset is impossible, and finding streaming datasets ready to be used with Kafka is quite difficult. This video showcases how you can start creating fake streaming data in minutes using Docker. CHAPTERS ABOUT AIVEN Aiven’s cloud data platform helps your business reach its highest potential by making your data work for you. It provides fully managed open source data infrastructure on all major clouds, helping developers focus on what they do best: innovate and create without worrying about the limitations of technology.
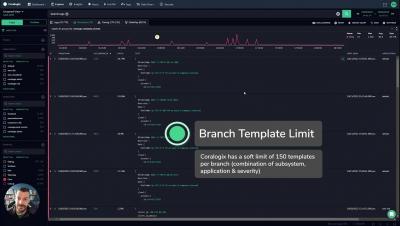
Coralogix Deep Dive - Loggregation, Features and Limitations
Coralogix Loggregation enables users to turn thousands, or millions, of logs into a handful of templates, using our very own priorietary clustering algorithm. This enables users to quickly understand all of the different errors they are experiencing, and generate powerful, cross cutting insights in only a few clicks.
Power of Pulseway Automation
Try Pulseway Automation Module here: https://www.pulseway.com/enterprise/evaluation


