Operations | Monitoring | ITSM | DevOps | Cloud

Measure Embedded Device Quality in the Field with Ease

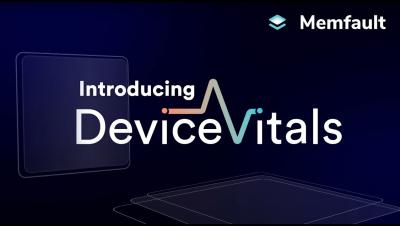
François Baldassari reveals our biggest product release yet. This pivotal launch marks a new era in IoT device performance monitoring, ensuring unparalleled insights into software stability, battery health, and connectivity— the three critical aspects of device vitality. Our latest breakthrough allows for the precise evaluation of your devices' quality, enabling swift identification and resolution of any issues. With François leading the charge, explore how our newest innovation empowers you to.

How to get Memfault Device Vitals up and running on an MCU (ESP32) - Integration Walkthrough

In this video Memfault Field CTO Thomas will walk you through each step to get your MCU based device integrated on Memfault and reporting crash data and our newly released, Device Vitals into Memfault. This walk through is using an ESP32 based device but the same principles can be applied to any MCU and we have lots of guidance available for different chipsets in our technical documentation.

Introducing Device Vitals

Memfault would like to introduce you to Device Vitals. To ensure that your product maintains its quality even after it is launched, it is crucial to monitor three key indicators for your devices in the field: stability, connectivity, and battery life. By collecting Device Vitals, you can have access to valuable data that helps you understand the overall health of your fleet and the quality of your product.

Centralized Multi-Cluster Management and Operations

Join us for our webinar on centralized multi-cluster management and operations, during which we’ll explore how to manage multiple clusters across various regions. This will teach you how to unify access control and authorization layers, ensuring secure, streamlined operations. Our panel will then dive into the challenges of maintaining consistent application deployment across all regions through a single console.

Observe, Automate and Optimize | SolarWinds Day Virtual Event

You can’t manage what you can’t monitor and observe. IT ecosystem complexity is a part of operating in a hybrid multi-cloud, containerized microservices, digital transformation world, and the complexity is not magically going away. This virtual event shows how SolarWinds is solving what others can’t – abstracting the complexity, increasing visibility, and automating remediation across on-premises, hybrid, and cloud-native estates.

Handling IT Procurement And Inventory of New Hardware And Software

Software and hardware acquisition is the first stage of the IT asset lifecycle and should be done cost-effectively and organized. To achieve that, you must set in place a well-defined procurement process. With it, you'll have a unified and normalized inventory that lets you know your IT assets in stock and their location, thus providing reliable insights on what you need to purchase and what is vacant or can be relocated.

How to Display Grafana Alerts to Your Dashboards | Grafana

💡 Did you know you can display Grafana alerts on your dashboards? Join Senior Developer Advocate Marie Cruz in this quick tutorial to learn how to configure a Grafana alert and link it to your dashboard and panel. ☁️ Grafana Cloud is the easiest way to get started with Grafana dashboards, metrics, logs, and traces.