Operations | Monitoring | ITSM | DevOps | Cloud

Synthetic web tests - Moving up the stack

In this short explainer and demo, Kentik's Phil Gervasi shows how Kentik is moving up the stack to monitor application activity on the network. Phil explains the differences between proactive and passive network monitoring and demonstrates three new synthetic tests that relate to app performance monitoring. Kentik's suite of application-focused synthetic tests give you proactive visibility into application activity on your network. Using the HTTP test, Page Load test, and Synthetic Transaction Monitoring, you can monitor a user's digital experience and troubleshoot problems as they happen.
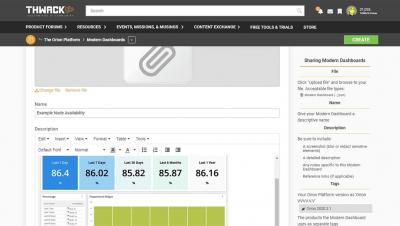

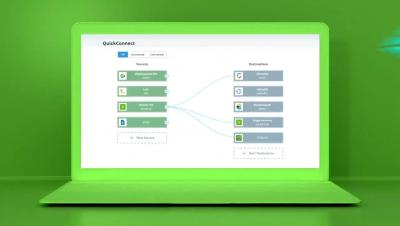
How to Import/Export Orion Modern Dashboards

The flexibility available in Modern Dashboards on the SolarWinds Orion Platform is nothing short of amazing. The dashboards are quick and easy to build and share. We'll guide you through the process of how to import a Modern Dashboard from THWACK and how to export your own to share with the SolarWinds community.

Datadog on Informed Product Development

Datadog is an observability and security platform. That means that our users may be in a high stress situation: debugging an issue in production, managing an incident or responding to a security threat. Having a good UX is particularly critical in those cases. User interviews are very helpful, but after a product has been released in production we are able to gather a lot more data to understand how customers interact with it and make decisions about how it can be improved.

An overview of Azimuth, an open source tool for systematic error analysis for text classification.

Thank you for watching this short video where we present Azimuth, an easy-to-use open-source tool that helps AI practitioners analyze AI models and datasets to check for errors in text classification. In this video, we walk you through a high-level overview of using Azimuth. The description below provides a summary of what is covered in the video.