Operations | Monitoring | ITSM | DevOps | Cloud

Introducing composite charts and Metric Correlations

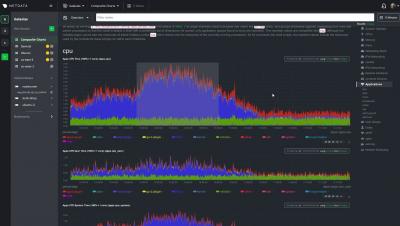
We're really excited about supercharging Netdata Cloud's infrastructure monitoring experience with composite charts. These charts look just like the ones you're familiar with, but feature real-time, per-second aggregated metrics from any number of distributed nodes from across your infrastructure. You can still pan, zoom, and highlight to your heart's content while also changing the aggregate function, filtering nodes, or jumping straight into single-node dashboards for root cause analysis.

JFrog & HashiCorp - Scale Your Developer's Talent

Join JFrog’s Baruch Sadogursky and HashiCorp’s Taylor Dolezal as they walk you through best practices for helping to enhance your team’s artifact experiences. Together HashiCorp and JFrog enable you to automate your application infrastructure end-to-end. While HashiCorp technologies implement Infrastructure as Code, the JFrog Platform manages all of the binaries, artifacts and dependencies for each build, and automates the software composition analysis, build information and deployment.