Operations | Monitoring | ITSM | DevOps | Cloud

Latest News

Exception Perceptions: Automate Your Workflow with Probot for GitHub Apps

On this episode of Exception Perceptions, GitHub Community Engineer Bex Warner stopped by to chat about Probot, a framework for automating GitHub. Watch the episode, and then read what else Bex has to say about the magic of Probot. Also, check out this example of what Sentry has built with Probot.

Alternative to Application Performance Monitoring (APM)

It’s essential to monitor server vitals such as CPU utilisation, memory usage and free disk space to spot the warning signs of impending doom (hands up those that have run out of disk space on a production server before. Many turn to Application Performance Monitoring (APM) software for help. But APM solutions can be expensive, require software to be installed and require system access that some people may not be comfortable with.

How to Identify Impactful Business Transactions in AppDynamics

New users of APM software often believe their company has hundreds of critical business transactions that must be monitored. But that’s not the case. In my role as Professional Services Consultant (EMEA) at AppDynamics, I’ve worked at dozens of customer sites, and the question of “What to monitor?” is always foremost in new users’ minds.

Grafana's Explore UI: Taking a Deeper Dive into Data with Prometheus Queries

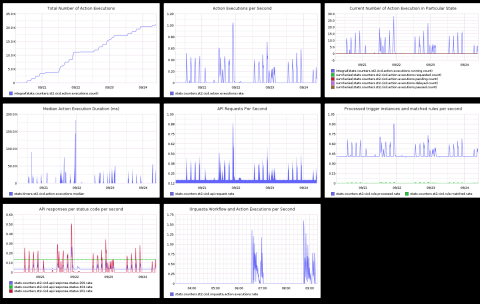
When there’s an incident, Grafana is often the starting point for figuring out a response. Users look at a time series panel and form a hypothesis. And in many situations, they’d like to dive deeper. To help make that easier, Grafana Labs has created the Explore UI, which allows you to iterate quickly through Prometheus queries, while leaving your dashboards intact.

Grafana as a Yet Another Tool for Technical Monitoring of Software Products We Build

One more article in Logicify Monitoring Tools series talks about Grafana, a software we use both for internal and external projects to visualize and analyze the data. The article could be of interest to CTOs, developers and DevOps, system administrators and Project Managers, and everyone interested.

Empower Teams To Make Data-Driven Decisions With OpsGenie's Infrastructure & Service Health Reports

Running your organization's infrastructure and understanding how services are performing a is key to ensuring every Dev and Ops team is running as efficiently as possible. The problem? Teams typically care about different metrics, so it can be hard to track the metrics you care about when they are not located on a central dashboard. Additionally, if these metrics are in central dashboard, it is often hard to dive deep and understand the root cause of your incidents and the performance of your team.