Operations | Monitoring | ITSM | DevOps | Cloud

Latest News

ServiceNow Integration Now Generally Available (Plus, Inbound Field Mapping)

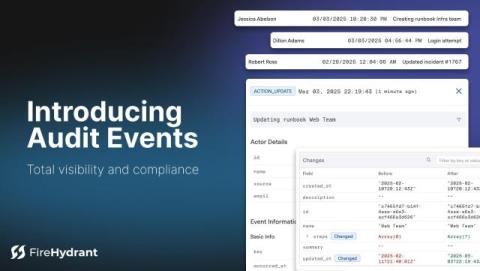
We’re thrilled to announce that our ServiceNow integration is now generally available (GA). For enterprises that rely on ServiceNow to power their ITSM, this integration creates a seamless bridge between engineers responding to incidents in FireHydrant and the broader organization. At FireHydrant, we are committed to delivering enterprise-grade solutions that go beyond the basics.

Calculating the business value of software delivery

For engineering leaders and technology decision-makers, CI/CD metrics have always been more than just operational measurements – they’re direct indicators of developer experience and team productivity. Every failed build, slow pipeline, or delayed deployment directly impacts your developers’ ability to deliver value.

Sentry's Pinia Integration for Vue and Nuxt Error Tracking

When debugging issues in production, context is everything. While Sentry already provides rich error data like stack traces, breadcrumbs, and user information, understanding the application state at the time of an error can still help reproduce, fix and ship quickly. Sentry’s Pinia integration solves this by automatically capturing Pinia state wherever errors occur. Now you get the complete picture of your Vue or Nuxt application's state at the moment things went wrong.

Optimizing RabbitMQ Performance: The Metrics That Matter

RabbitMQ is a powerful, reliable, and widely used message broker that forms the backbone of modern microservices architectures. However, ensuring its performance and reliability requires proactive monitoring of key metrics. In this blog, we will explore the essential RabbitMQ metrics, their units, possible issues, solutions, and how tools like Atatus can simplify monitoring and troubleshooting.

TikTok Emerges from Shutdown Without Bytedance's US CDN

Kentik’s Doug Madory looks into this weekend’s 14-hour outage of popular video sharing service TikTok, which was slated to be banned from the US per recent legislation. While TikTok came back, it is notably no longer being served by parent company Bytedance’s US CDN. We delve into the traffic statistics in this blog post.

How to fix the root cause of a failed reliability test

You’re well on your way to becoming more reliable. You’ve added your services, found and fixed some Detected Risks, and run your first set of reliability tests. However, some of your tests returned as “Failed.” Not to worry: this isn’t a reflection of you or your engineering skills but rather an opportunity to learn more about how your systems work and, more importantly, how to make them more resilient.

How to Build a Cloud Strategy That Works for Your Business

As technology advances at lightning speed, more and more businesses are turning to the cloud to boost growth, improve efficiency, and stay ahead of the competition. However creating a cloud strategy that matches your business goals, budget, and security needs can be tricky. It’s not just about switching to the cloud—it’s about using it wisely to get the most out of it.

Serilog: Configuration, Error Handling & Best Practices

When building modern.NET applications, logging is one of those things you don’t want to get wrong. Serilog steps in as a popular logging framework that has earned its spot as a go-to tool for developers. Why? Because it’s flexible, versatile, and does an awesome job of giving you clear insights into your app's behavior. But what exactly is Serilog?

SLF4J vs Log4j: Key Differences and Choosing the Right One

When building robust, maintainable, and scalable Java applications, logging plays an essential role in debugging, monitoring, and ensuring smooth performance. Two of the most widely used logging frameworks in the Java ecosystem are SLF4J and Log4j. While both serve similar purposes, they offer different approaches and features, making it important to understand their differences before making a choice.

Lumigo Upgrades Kubernetes Operator for More Insights, Exponential Savings, and Simplicity

We’re excited to introduce the enhanced Lumigo Kubernetes Operator, now more powerful than ever. With just a quick installation, you gain comprehensive observability—bringing together logs, metrics, and traces in a single platform to provide deeper insights and faster troubleshooting. The improved Lumigo Kubernetes Operator unlocks cluster-wide visibility by collecting key infrastructure metrics and logs—allowing you to monitor, analyze, and optimize with minimal effort.