Operations | Monitoring | ITSM | DevOps | Cloud

Latest News

What's new in Grafana Cloud for September 2021: New panels, query caching, synthetic monitoring updates, and more

Here at Grafana, we’re constantly shipping new features to help our users get the most out of Grafana Cloud. Over the last few months, we’ve made it even easier to get started with out-of-the-box dashboards and new visualizations in Grafana Cloud. We also introduced capabilities like query caching, a “prettify JSON” option and commands for cortex-tools to make your data, dashboards, and queries more efficient.

Managing IoT Software Updates at Scale: Our Acquisition of Upswift

With the increasing proliferation of connected devices, it might be assumed that deploying software to devices, providing incremental updates, application security and IoT device management at scale are all rolled into companies’ DevOps pipelines as one big happy portfolio. Sadly, this has not been the case to date. Most IoT software updates and management solutions today are operated in a complete silo from corporations’ DevOps processes.

Logz.io's New Lookz is Generally Available!

Back in June, we announced the Public Beta for Logz.io’s New Lookz – which is a new UI that completely changes the way users navigate across Logz.io products and features. The Public Beta gave users the option to toggle between the old and new UIs to see which one they liked better. And the answer from our users was as clear as it could be.

Announcing the General Availability of VMware Tanzu Kubernetes Grid 1.4

We are excited to announce the general availability of VMware Tanzu Kubernetes Grid 1.4. This release introduces improvements and updates to networking, packages, the user experience, and as always, Kubernetes versioning, with support for Kubernetes 1.21.2. In this post, we will focus on some of the new capabilities offered in Tanzu Kubernetes Grid 1.4 that further support our customers with their Kubernetes journey.

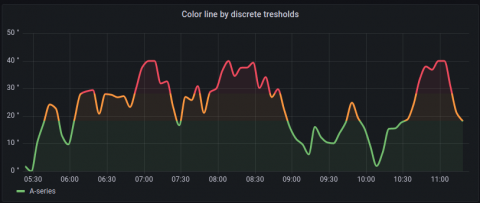
New in Grafana 8.1: Gradient mode for Time series visualizations and dynamic panel configuration

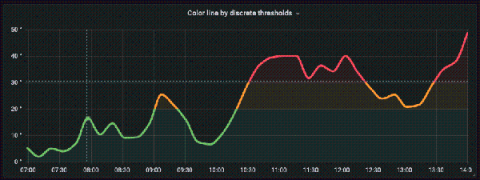
Grafana 8 brought with it many exciting new features, including the launch of a new alerting system and the expansion of Grafana’s live and streaming data functionality. We didn’t stop there. In Grafana 8.1, alongside new additions like the Geomap and Annotations panel, we introduced some new features to the Time series panel as well as two transformations to help make panel configuration more dynamic.

ServiceNow is a Leader in the 2021 Gartner Magic Quadrant for ITSM-8 years in a row

We’re thrilled to be positioned as a Leader in the 2021 Gartner Magic Quadrant for ITSM (Information Technology Service Management) Tools. That’s eight years in a row that ServiceNow® ITSM has been positioned as a leader. You might wonder if, after all these years, the shine starts to wear off. In fact, we could not be more excited about this recognition. We’re happy to note that we’re positioned highest in both vision and the ability to execute.

Metrics now generally available in Honeycomb

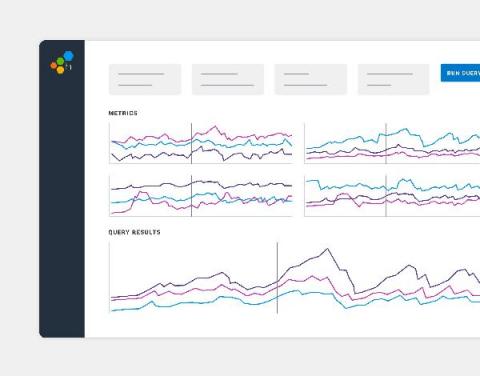
Starting today, Honeycomb Metrics is now generally available to all Enterprise customers. You’ve adopted our event-based observability practices, in part to overcome the debugging roadblocks you hit when using custom metrics to identify application issues. But metrics do still provide value at the systems level. Now, you can easily see and use your metrics data alongside your event data in Honeycomb—all in one interface.