Kubernetes (k8s) enables you to efficiently orchestrate container management, in the cloud or on-premises. As a whole, k8s provides many benefits, including features for self-healing, automated rollouts and rollbacks, load distribution, and scalability. However, k8s is a highly complex platform and requires extensive configuration.
Isn’t all logging pretty much the same? Logs appear by default, like magic, without any further intervention by teams other than simply starting a system… right? While logging may seem like simple magic, there’s a lot to consider. Logs don’t just automatically appear for all levels of your architecture, and any logs that do automatically appear probably don’t have all of the details that you need to successfully understand what a system is doing.
After my last blog around sending Github Data to Splunk via Webhooks, I received a healthy amount of feedback that I want to address here. I learned that (unsurprisingly) a lot of customers are curious about, or dependant on, other cloud platforms out there. In fact, I heard directly from some customers who specifically cannot use any other cloud platforms than one in particular that was not highlighted in my last blog.
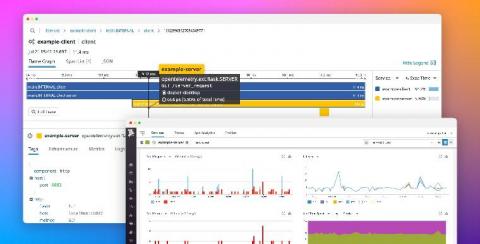
If you are familiar with OpenTracing and OpenCensus, then you have probably already heard of the OpenTelemetry project. OpenTelemetry merges the OpenTracing and OpenCensus projects to provide a standard collection of APIs, libraries, and other tools to capture distributed request traces and metrics from applications and easily export them to third-party monitoring platforms.
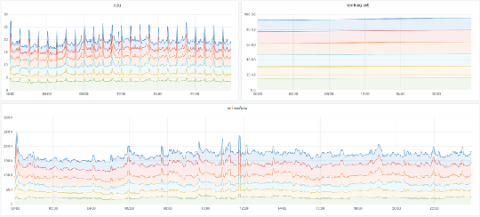
Jaeger primarily supports two backends: Cassandra and Elasticsearch. Here at Grafana Labs we use Scylla, an open source Cassandra-compatible backend. In this post we’ll look at how we run Scylla at scale and share some techniques to reduce load while ingesting even more spans. We’ll also share some internal metrics about Jaeger load and Scylla backend performance. Special thanks to the Scylla team for spending some time with us to talk about performance and configuration!
Time trolls people. It speeds up in good times and slows down in bad. For instance, when you push code, your brain feels like it’s in a whirlwind. But when you’re debugging subsequent errors, the hours seem to slog by. This is particularly true if you are operating without context and without the help of automation. Fortunately, our friends at GitHub built an automation platform for products like Sentry to integrate with: Sentry Release GitHub Action.
As the automation surface area grows to accommodate hundreds of interconnected APIs on the cloud, developers are using their own, home-grown “digital duct tape” to manage a growing “DevOps dumping ground”. For a lot of organizations, home-grown glue logic is inconsistent, not repeatable, and expensive to maintain hundreds of event-based workflows and thousands of combinations. We believe that the answer lies in automation workflows.