Operations | Monitoring | ITSM | DevOps | Cloud
Latest Blogs
Ensuring reliability when modernizing financial applications
For decades, information technology in the financial services industry meant deploying bulky applications onto monolithic systems like mainframes. These systems have a proven track record of reliability, but don’t offer the flexibility and scalability of more modern architectures such as microservices and cloud computing. During periods of unexpectedly high demand, this inflexibility can cause technical issues for organizations ranging from personal trading platforms to major banks.
10 features to consider when choosing your MSP support tool
Managed Service Providers (MSPs) in IT have the unenviable task of hastening the digital transformation in companies, especially during these trying times. It becomes even more onerous, considering that the hardest-hit segment of Small and Medium Businesses (SMBs) are their major customers. According to the Global State of the MSP report, cloud migrations and security are expected to be the top drivers of MSPs growth for MSPs in 2020.
7 Ways APM Helps IT Chart a Clear Course for Running Apps in the Cloud
Want to ensure a smooth migration to the cloud? Read on to learn about what you need to do before and after to chart a clear course for success.
A Look at the New Calico eBPF Dataplane
Calico was designed from the ground up with a pluggable dataplane architecture. The Calico 3.13 release introduced an exciting new eBPF (extended Berkeley Packet Filter) dataplane targeted at those ready to adopt newer kernel versions and wanting to push the Linux kernel’s latest networking capabilities to the limit.
Maintaining Employee Experience with G Suite Monitoring
Today, we are excited to share the first in a series of Employee Experience (EX) focused eBooks, helping you understand how Catchpoint can be used to ensure you get the best digital performance for your employees. In this eBook, we focus on five use cases, demonstrating through examples, how to best utilize digital experience monitoring for G Suite.
Advanced Network Monitoring with Pandora FMS
Pandora FMS has become well known as a reliable, flexible advanced network monitoring solution. It allows businesses of all sizes to monitor and manage network and hardware issues in real time, and integrates all of the monitored terminals, servers, and other entities into a centralized system. These features mean that Pandora FMS has become the go-to choice for small businesses looking to deploy advanced network monitoring technologies for the first time.
Kubernetes observability tutorial: Monitoring application performance with Elastic APM
This post is the third in our Kubernetes observability tutorial series, where we explore how you can monitor all aspects of your applications running in Kubernetes, including: We’ll discuss using Elastic Observability to perform application performance monitoring (APM) with the Elastic APM.
What Data Types to Prioritize in Your SIEM
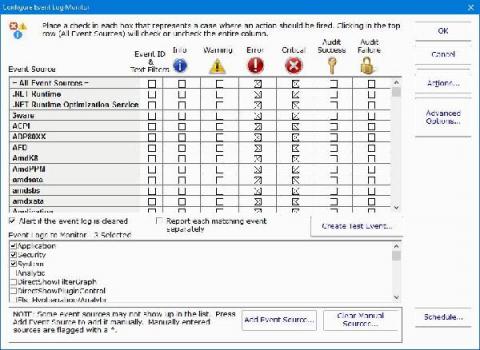
Server Monitoring and Alerts - Getting Past Common Obstacles
Keeping a server running optimally on a consistent basis involves managing multiple system elements simultaneously. Automated scripts and specialized software can handle the tasks your server needs to complete on a daily basis—but when one of these experiences an error, it can throw the entire system off.


