Operations | Monitoring | ITSM | DevOps | Cloud

The latest News and Information on Distributed Tracing and related technologies.

OpenTelemetry Webinars - The Trace API

Join Nica and Srikanth to talk in detail about the OpenTelemetry Trace API. We'll talk about adding spans, events, attributes and other extra info, whether it's really possible to replace logs with traces, and more More about SigNoz: SigNoz - Monitor your applications and troubleshoot problems in your deployed applications, an open-source alternative to DataDog, New Relic, etc. Backed by Y Combinator.

Unlocking Open Telemetry for Golang

Open Telemetry (OTel) is an open source observability framework that has garnered significant attention for its powerful capabilities in monitoring metrics, logs and traces.. It is second only to Kubernetes in the CNCF velocity chart with contributions being made from major players in the cloud industry, and has a growing community helping build out a thriving ecosystem.

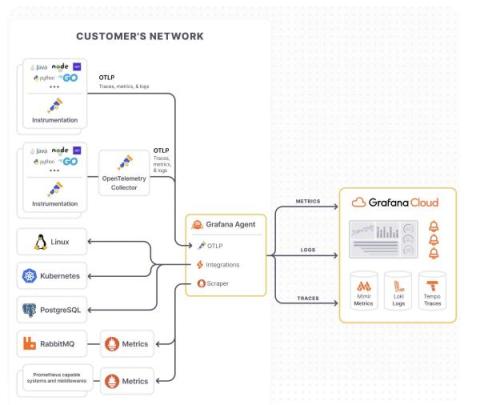
Announcing Application Observability in Grafana Cloud, with native support for OpenTelemetry and Prometheus

The Grafana LGTM Stack (Loki for logs, Grafana for visualization, Tempo for traces, and Mimir for metrics) offers the freedom and flexibility for monitoring application performance. But we’ve also heard from many of our users and customers that you need a solution that makes it easier and faster to get started with application monitoring.

Distributed Tracing: Your Ultimate Guide

When all your IT systems, your apps and software, and your people are spread out, you need a way to see what’s happening in all these minute and separate interactions. That’s exactly what distributed tracing does. Distributed tracing is a way to tracking requests in applications and how those requests move from users and frontend devices through to backend services and databases.

What is OpenTelemetry? A Comprehensive Guide

An Essential Guide to OpenTelemetry In today’s expeditious, highly distributed software landscape, achieving true observability is no simple task. As you strive to understand how your applications and services perform and behave, you face multiple challenges. Moreover, you need to instrument applications and services that generate data effectively, have a reliable means to transmit it, and, most importantly, find a way to visualize and derive insights from it.

Simplify OpenTelemetry Pipelines with Headers Setter

In telemetry jargon, a pipeline is a directed acyclic graph (DAG) of nodes that carry emitted signals from an application to a backend. In an OpenTelemetry Collector, a pipeline is a set of receivers that collect signals, runs them through processors, and then emits them through configured exporters. This blog post hopes to simplify both types of pipelines by using an OpenTelemetry extension called the Headers Setter.