The latest News and Information on Monitoring for Websites, Applications, APIs, Infrastructure, and other technologies.
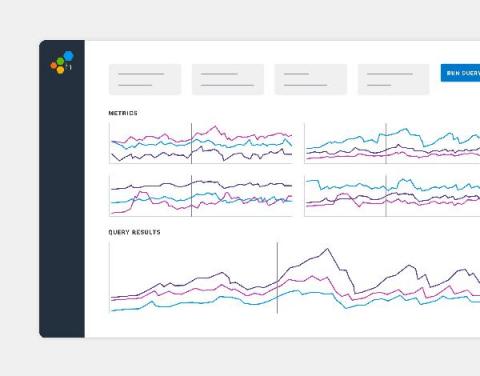
Starting today, Honeycomb Metrics is now generally available to all Enterprise customers. You’ve adopted our event-based observability practices, in part to overcome the debugging roadblocks you hit when using custom metrics to identify application issues. But metrics do still provide value at the systems level. Now, you can easily see and use your metrics data alongside your event data in Honeycomb—all in one interface.
Open Telemetry represents an effort to combine distributed tracing, metrics and logging into a single set of system components and language-specific libraries. Recently, OpenTelemetry became a CNCF incubating project, but it already enjoys quite a significant community and vendor support. OpenTelemetry defines itself as “an observability framework for cloud-native software”, although it should be able to cover more than what we know as “cloud-native software”.
In order to produce their masterpieces, artists like van Gough, Rembrandt, Picasso, and Monet painted with more than just one color. Being able to choose from multiple colors (not to mention an abundance of talent, inspiration, and creativity) is what allowed these artists to see their complete vision come to life on canvas. However, if you’re relying on a single set of data to troubleshoot network issues, it’s like you’re stuck painting with one color.
If you were to put 100 enterprise tech leaders in a room together and ask them if they think their company’s employee experience is dependent upon IT, I’m certain all would agree it is. But I’m also certain those 100 wouldn’t know: For IT decision-makers, the devil is in the details. Many are judged by uncompromising Service Level Agreements (SLAs) and shoddy survey data, not comprehensive digital experience trends and indexes.
A few days ago I received an inquiry about a scripting problem from one of our longtime partners, to be exact our DCP Marc Handel from IT unlimited AG. In the exchange with Marc I realized that his idea to use the Enterprise Alert Scripting Host, the Windows Task Scheduler and CheckMK to realize a roundtrip monitoring could be interesting for the whole community. Especially for all our CheckMK customers.
Observability data, and especially log data, is immensely valuable for modern business. Making the right decision—from monitoring the bits and bytes of application code to the actions in the security incident response center—requires the right people to generate insights from data as fast as possible.
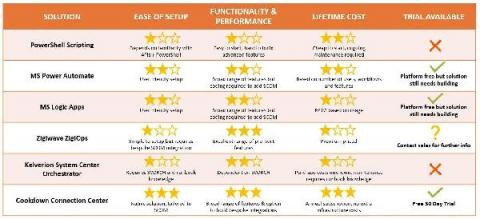
If you’re looking to integrate SCOM with your other IT applications your main drivers are probably centered around; increasing efficiency, improving stakeholder engagement, and smashing your incident response times!