Operations | Monitoring | ITSM | DevOps | Cloud


The latest News and Information on Monitoring for Websites, Applications, APIs, Infrastructure, and other technologies.



IT in Motion: The Day After The Layoff

How Monitoring, Observability & Telemetry Come Together for Business Resilience
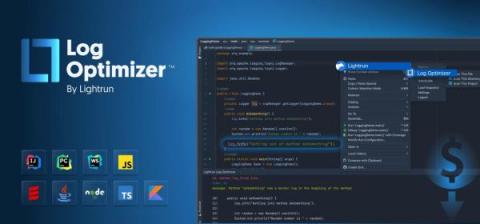
Reduce 60% of your Logging Volume, and Save 40% of your Logging Costs with Lightrun Log Optimizer
As organizations are adopting more of the FinOps foundation practices and trying to optimize their cloud-computing costs, engineering plays an imperative role in that maturity. Traditional troubleshooting of applications nowadays relies heavily on static logs and legacy telemetry that developers added either when first writing their applications, or whenever they run a troubleshooting session where they lack telemetry and need to add more logs in an ad-hoc fashion.
How Synthetic Transaction Monitoring Provides Complete Site Visibility & Why Basic Monitoring is Not Enough
We’ve all been in the situation before: it’s Friday at 5 PM and the only on-call engineer available to handle incidents is about to hit the slopes. Unfortunately, at that very moment, a customer reports to support that they are unable to access the company’s ecommerce website to complete a purchase. Internal monitoring systems seem quiet and services appear available on internal health dashboards.

Monitoring with Custom Metrics
By kickstarting a monitoring project with Prometheus, you might realize that you get an initial set of out-of-the-box metrics with just Node Exporter and Kube State Metrics. But, this will only get you so far since you will just be performing black box monitoring. How can you go to the next level and observe what’s beyond? They are an essential part of the day-to-day monitoring of cloud-native systems, as they provide an additional dimension to the business and app level.

Why is Icinga called Icinga?
It’s the year 2009, a nice weekend in late spring and a small group of monitoring enthusiasts comes together to discuss how to move forward with the idea of forking Nagios. The Icinga team in 2009, just to set the mood. Plans were made to make it faster, easier, more scalable, and simply better. Of course, such a project has a lot of hurdles to take – the most important one was of course: the name.

How Splunk Users can Maximize Investment with CloudFabrix Log Intelligence
How 3 Companies Implemented Distributed Tracing for Better Insight into Their Systems
Distributed tracing enables you to monitor and observe requests as they flow through your distributed systems to understand whether these requests are behaving properly. You can compare tiny differences between multiple traces coming through your microservices-based applications every day to pinpoint areas that are affecting performance. As a result, debugging and troubleshooting are simpler and faster.