Operations | Monitoring | ITSM | DevOps | Cloud

The latest News and Information on Monitoring for Websites, Applications, APIs, Infrastructure, and other technologies.

How Delivery Hero uses Kubecost and Datadog to manage Kubernetes costs in the cloud

As the world’s leading local delivery platform, Delivery Hero brings groceries and household goods to customers in more than 70 countries. Their technology stack comprises over 200 services across 20 Kubernetes clusters running on Amazon EKS. This cloud-based, containerized infrastructure enabled them to scale their operation to support increasing demand as the volume of orders placed on their platform doubled during the pandemic.
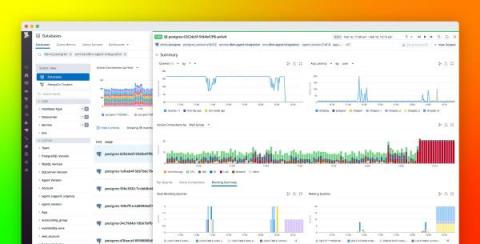
Troubleshoot blocking queries with Datadog Database Monitoring

Blocked queries are one of the key issues faced by database analysts, engineers, and anyone managing database performance at scale. Blocking can be caused by inefficient query or database design as well as resource saturation, and can lead to increased latency, errors, and user frustration. Pinpointing root blockers—the underlying problematic queries that set off cascading locks on database resources—is key to troubleshooting and remediating database performance issues.

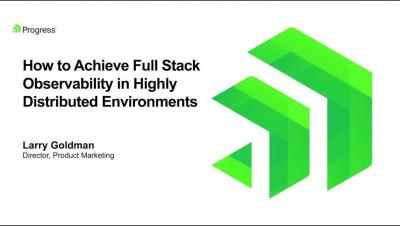
How to Achieve Full Stack Observability in Highly Distributed Environments Webinar

Your modern IT infrastructure has become an increasingly complicated mix of on-premises, public and private cloud applications, devices and environments. Forward-thinking organizations are addressing this complexity by transitioning to a proactive “observability” approach for infrastructure management. This methodology produces and then applies actionable data to optimize and secure the entire network.

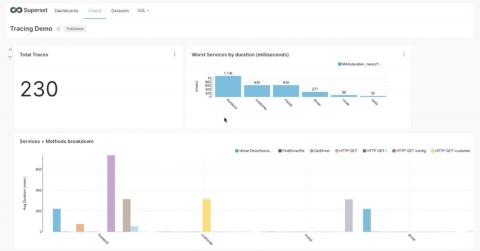
Webinar Highlight: Introducing InfluxDB's New Time Series Database Engine

As part of the InfluxDB Cloud, powered by IOx launch, Paul Dix and Balaji Palani provided an InfluxDB Cloud overview and demo. In case you missed it, this blog is a quick 5 minute read summarizing the webinar. We shared the recording and the slides from the presentation for everyone to review and watch at your leisure.

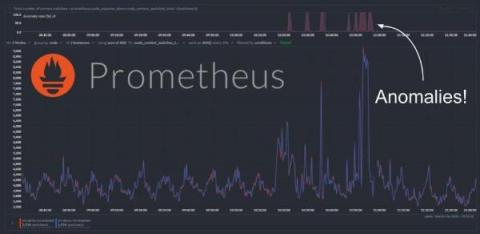
Anomaly detection on Prometheus metrics

We have recently extended the native machine learning (ML) based anomaly detection capabilities of Netdata to support all metrics, regardless on their collection frequency (update every). Previously only metrics collected every second were supported, but now Netdata can run anomaly detection out of the box with zero config on metrics with any collection frequency.

Public Dashboards, Incident Management, and Our New Analytics API

Late last year we announced improvements to our public dashboards that included a revamped dashboard design that allowed users to see monitoring data in a more easily-digestible way, on any device. We improved performance across the board, and also introduced new incident management functionality—available for paid plans only—that allows users to more easily communicate scheduled maintenance notices and alert developers to minor and major incidents.