The latest News and Information on Monitoring for Websites, Applications, APIs, Infrastructure, and other technologies.
Picture a simple E-commerce platform with the following components, each generating logs and metrics. Imagine now the on-call Engineer responsible for this platform, feet up on a Sunday morning watching The Lord of The Rings with a coffee, when suddenly the on-call phone starts to ring! Oh no! It’s a customer phoning, and they report that sometimes, maybe a tenth of the time, the web front end is returning a generic error as they try to complete a workflow.
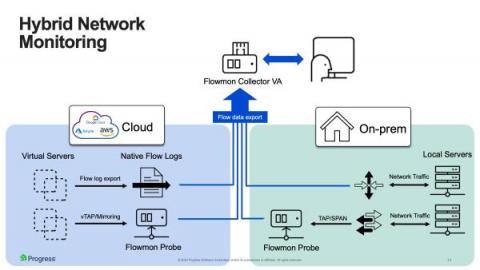
This model has benefits, but at the same time, it introduces complexity for the IT teams tasked with monitoring and securing IT systems. Existing network monitoring technologies that system admins use with on-premise infrastructure are typically not expandable to include infrastructure and services running on public cloud platforms. This is a problem as you cannot manage and secure what you cannot see.
Delve into the features and benefits of Honeybadger alongside other error monitoring tools, as we compare their strengths and weaknesses. Find the perfect fit for your needs and elevate your error monitoring game.
In today's fast-paced and rapidly-evolving business landscape, it's more important than ever to keep track of how well your software applications are performing. That's where the Apdex score comes in. As a metric for measuring the user experience of an application, the Apdex score provides valuable insights into how your software is performing and how it can be improved.
In the world of constant connectivity and digital realm, velocity is vital. Imagine a user reaching your website only to be met with a stark, blank page. Their anticipation hangs in the balance as they await any sign of engagement. Such an encounter does little to endorse the readiness or accessibility of your business. In today’s hyper-connected world, every single millisecond carries profound significance.
Limited visibility into network performance across multi-clouds frustrates even the best teams. That’s why we’re thrilled to announce enhanced AWS and GCP support for Kentik Cloud, enabling network, cloud, and infrastructure teams to rapidly troubleshoot and understand multi-cloud traffic.
In the complex and dynamic realm of data analytics, real-time anomalies serve as insights to issues a business faces. A pervasive and enduring conundrum persists: accurately discerning between anomalies of significant importance and those of lesser consequence. This distinction is a nontrivial task as not all anomalies bear the same weight.