The latest News and Information on Monitoring for Websites, Applications, APIs, Infrastructure, and other technologies.
Testing enables you to proactively identify and resolve issues before they break critical functionality in your application, which is essential to ensuring an optimized user experience (UX). However, if you don’t know how users are actually interacting with your application, key user journeys may go untested. This lack of visibility can lead to a proliferation of unoptimized features in your UI, causing users to drop off before completing important actions.
As a new Datadog customer, your top priority is figuring out how to maximize the platform’s potential and deliver value to your organization quickly and seamlessly. But with a plethora of options and configurations available at your disposal, it can be overwhelming to determine where to begin. With Datadog, you don’t need to be an expert in observability or monitoring to get up and running efficiently.
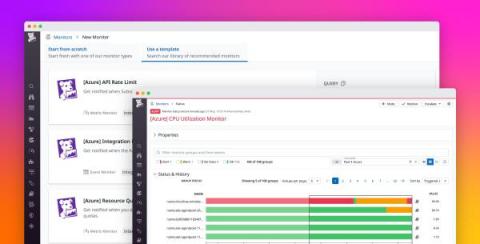
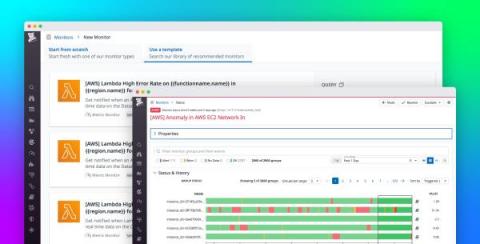
When you first onboard to a monitoring and security platform, it can be difficult to know where to start. Which services should you monitor? What thresholds should you set? How often should you alert your team, and where’s the best starting point for investigations?
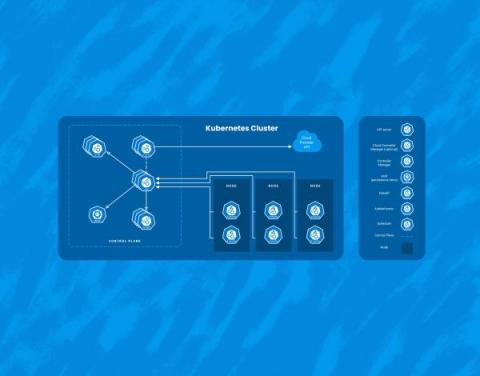
While Kubernetes comes with a number of benefits, it’s yet another piece of infrastructure that needs to be managed. Here, I’ll talk about three interesting ways that Honeycomb uses Honeycomb to get insight into our Kubernetes clusters. It’s worth calling out that we at Honeycomb use Amazon EKS to manage the control plane of our cluster, so this document will focus on monitoring Kubernetes as a consumer of a managed service.
The adoption of software-defined wide area network (SD-WAN) technologies continues to pick up pace. By employing SD-WAN technologies, organizations have the potential to realize a range of advantages. Teams can achieve better performance while using lower cost, using commercially-available technologies. For example, teams can use public internet services rather than more expensive private WAN technologies, such as MPLS.
We’ve all been there: Sleeping peacefully in bed over the weekend, finally getting rest after a long week at your computer making AI-generated memes writing code. Then at 3 a.m., your phone makes an ungodly sound, and you wake up startled, frazzled, and confused. When you finally type in your passcode to unlock your phone (because facial recognition doesn’t register your bleary-eyed, squinty face), you see an alert, and all dreams of sleep are over.
The modern factory’s relationship with data is experiencing a major change. Data now shapes the future rather than only telling the story of the past. The language inside the factory sounds like higher Overall Equipment Effectiveness (OEE) as the result of a shift from preventive to predictive maintenance. It could also look like expanding business goals to a new market based on impactful data-driven decisions. A change in purpose requires an update in technology.
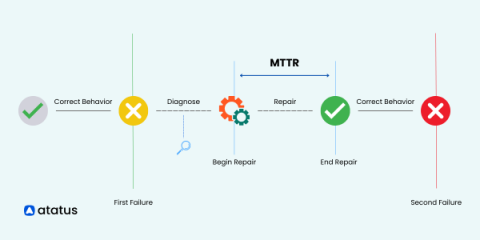
In the fast-paced world of software development, every minute counts. When disruptions occur, whether there are minor or major system failures, organizations need to bounce back to maintain seamless operations. That's where MTTR (Mean Time to Repair) steps onto the stage as a game-changing metric. Are you ready to unlock the secrets behind reducing downtime, boosting performance, and ensuring software reliability?