Operations | Monitoring | ITSM | DevOps | Cloud

The latest News and Information on Monitoring for Websites, Applications, APIs, Infrastructure, and other technologies.

Elastic Observability 8.12: GA for AI Assistant, SLO, and Mobile APM support

Elastic® Observability 8.12 announces general availability (GA) for the AI Assistant, Service Level Objectives (SLO), and Mobile APM support: Elastic Observability 8.12 is available now on Elastic Cloud — the only hosted Elasticsearch® offering to include all of the new features in this latest release. You can also download the Elastic Stack and our cloud orchestration products, Elastic Cloud Enterprise and Elastic Cloud for Kubernetes, for a self-managed experience.

Icinga DB Web migration made easier

For users using monitoring module, migrating their custom dashboards, navigation items and permissions and restrictions to Icinga DB Web has been made easier with the recent Icinga DB Web release (v1.1.1) through its migrate command. Once Icinga DB Web has been upgraded to v1.1.1, run the command icingacli icingadb migrate --help to see the avaliable actions under migrate command and what each action does.

How to Monitor PostgreSQL metrics with OpenTelemetry

PostgreSQL metrics monitoring is important to ensure that PostgreSQL is performing as expected and to identify and resolve problems quickly. In this tutorial, you will install OpenTelemetry Collector to collect PostgreSQL metrics and then send the collected data to SigNoz for monitoring and visualization. In this tutorial, we cover: If you want to jump straight into implementation, start with this prerequisites section.

How to Analyze Problems with Root Cause Analysis - Full Guide

To understand what a Root Cause Analysis (RCA) is, we must start from the fact that a root cause is a factor that causes a non-conformance and must be deleted through process improvement. The root cause is the central issue and the highest-level cause that sets in motion the entire cause-and-effect reaction that ultimately leads to the problem.

Anodot vs. Cloud Ctrl Cost: Which is better for Cloud FinOps capabilities?

Our solution (Anodot) and Cloud Ctrl Cost are two popular choices for a FinOps solution. With the increasing number of businesses moving to the cloud, having a third-party cost management solution like FinOps can handle all the challenges and maximize productivity in the cloud. So, which platform offers a complete FinOps solution? Let’s dig deeper and analyze who provides the best solutions, technology, and support to make the most of your FinOps culture.

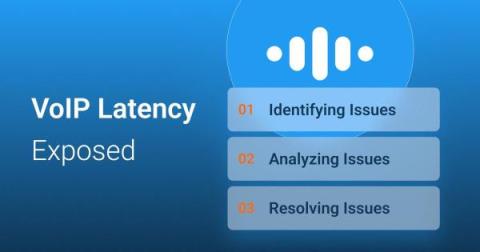
VoIP Latency Exposed: A Guide to Identifying, Analyzing, and Resolving Issues

Welcome to the world of seamless communication, where Voice over Internet Protocol (VoIP) has revolutionized the way we connect. However, amidst the convenience and clarity that VoIP promises, there's a subtle disruptor that often goes unnoticed but can significantly impact the user experience: VoIP latency. In this article, we’ll be exploring VoIP latency—unveiling the mysterious delays that can occur during your virtual conversations.

Easily Monitor URL and IP Availability Using Telegraf with Ping

Monitoring your domain URLs and server IPs is important for many reasons and plays a crucial role in ensuring the health, performance, and security of a network or web application. Monitoring hosted IPs within your infrastructure helps track the availability and uptime of websites and services. It also allows organizations to identify and respond quickly to downtime or outages, minimizing the impact on users.