Operations | Monitoring | ITSM | DevOps | Cloud

How Will PUE Caps In Singapore Change The Way Data Centers Are Managed?

Power Usage Effectiveness has long been used as a metric to calculate data center efficiency. For roughly the last two decades, this popular metric has been used to manage data centers throughout the world. In Singapore, arguably one of the leading data center hubs in Southeast Asia with 1.4 gigawatts capacity, future PUE limits are likely to force operators of both new and existing data centers to modify their facilities and how they are managed.
How to Build a Self-Improving Operations System in 5 Steps

With AI agents and AI-generated code becoming the norm in modern enterprise software, backend systems are evolving faster than ever. And it’s leaving most operations teams with an impossible choice: burn out senior talent on repetitive firefighting, or hand production over to untrained AI agents. With disruptions costing enterprises an average of $300,000 per hour, manual firefighting isn’t an option.

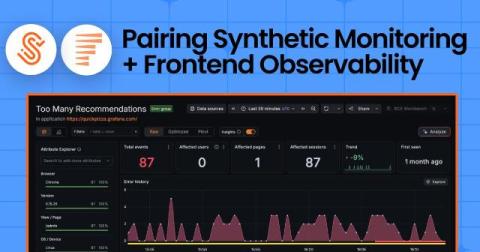
From failed check to real user impact: Pairing Synthetic Monitoring and Frontend Observability in Grafana Cloud

Say you get a support escalation about a page in the app that won’t load. But when you pull up your synthetic checks, they're all green: 100% uptime, probes are passing. Something's not adding up, but which one do you trust? If you’ve run Grafana Cloud Synthetic Monitoring, you’ve been on both sides of this. Sometimes it's the ticket: real users hit a wall on the path but your checks pass cleanly. Other times, it’s the inverse.

Knowledge Graph as context for LLMs: demonstrating decisive RCA and faster production performance

On the product team here at Grafana Labs, we consider AI agents our users, too. That’s why we set out to test how well agents can debug incidents across the full stack, and how much better they perform with Grafana Cloud’s Knowledge Graph vs. using raw telemetry alone. Our early results are promising. In one real incident we replayed 16 times each way, an agent with Knowledge Graph context found the correct root cause 15 times, compared with just once using raw telemetry alone.

Meet the official UptimeRobot CLI.

Managing monitors has meant one of two things: the dashboard, or writing your own API calls. There is now a third. The official UptimeRobot CLI is live on npm, and it drives every monitor, incident, and status page in your account from the shell you already have open. It is free, open source under Apache 2.0, and works on every plan including the free one.

Built-in Action Connectors in InvGate Service Management: What They Do

InvGate Service Management includes a no-code workflow builder that helps teams automate processes such as onboarding, access requests, and offboarding. Built-in Action Connectors extend those workflows beyond the platform, allowing them to retrieve information from external tools or trigger actions in them instead of stopping when another system is involved. You can keep processes moving across the tools your teams already use, reducing manual steps and keeping related actions connected.

Private cloud vs. Public cloud: Which delivers greater control and flexibility?

As businesses evolve in today’s digital landscape, the need for efficient and scalable computing resources has become paramount. In the early days of the Internet, large corporations would build or rent out large data centers to run their applications and serve customers. This was great as they could use dedicated hardware and expand as they pleased.

10 Tools To Build Visibility in AI-Driven Answers in 2026

People increasingly ask AI assistants for recommendations before they ever open a website, and Google now answers a large share of searches with an AI Overview. When the assistant names a few options, those are the brands that get considered. Most people never scroll to the sources behind the answer.