Operations | Monitoring | ITSM | DevOps | Cloud

The latest News and Information on Monitoring for Websites, Applications, APIs, Infrastructure, and other technologies.

10 Ways to Get Ahead with OpsRamp's AIOps

IT operations departments in larger enterprises often use 10-15 monitoring tools across different teams to track the health and availability of their core business services. Rather than helping ITOps teams gain a comprehensive view of their infrastructure, an overload of monitoring tools tends to only compound organizational silos and limit insights for incident troubleshooting. Yes, there is too much of a good thing.


Why Observability Is the Key Ingredient to Success

Digital transformation is accelerating at a staggering pace. Consider these statistics. In December 2019, Splunk partner Zoom had 10 million monthly active users. By the end of last year, that number was estimated to be closer to 300 million. It was part of an explosion of technological growth replicated across many industries and businesses in 2020. As Splunk CEO Doug Merritt said.

The Déjà Vu Evolution of Cloud Computing

I believe that the evolution to hybrid cloud is inevitable. Not because it’s grabbing headlines, but because it mirrors the industry’s history of new technology adoption. Take the evolution of virtualization, for example. Going back 20 years give or take, virtual machines popularized by VMware, KVM, and Hyper-V started to gain traction.

Efficiently Monitor the State of Redis Database Clusters

Monitoring Redis, the open source in-memory data platform, is complicated enough when you are hosting your Redis instance on just a single server. It gets even more complex when you build a Redis cluster that consists of multiple nodes and distribute your data across them. But as long as you know which metrics to prioritize and how to collect them, Redis monitoring is feasible enough. This article offers an overview of how to monitor the state of Redis database clusters.

TL;DR InfluxDB Tech Tips: Debugging and Monitoring Tasks with InfluxDB

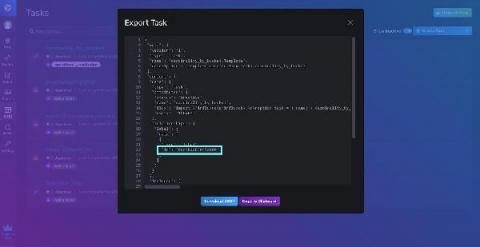
With InfluxDB you can use Tasks to process data on a schedule. You can also use tasks to write custom alerts. However, sometimes your task will fail. In this TLDR, we’ll learn how to debug your task with the InfluxDB UI and the InfluxDB CLI.

VPN and Firewall Log Management

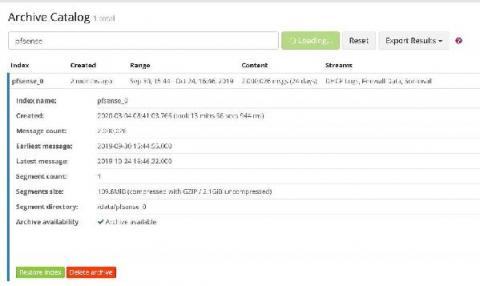
The hybrid workforce is here to stay. With that in mind, you should start putting more robust cybersecurity controls in place to mitigate risk. Virtual private networks (VPNs) help secure data, but they are also challenging to bring into your log monitoring and management strategy. VPN and firewall log management gives real-time visibility into security risks. Many VPN and firewall log monitoring problems are similar to log management in general.

Trace AWS event-driven serverless applications with Datadog APM

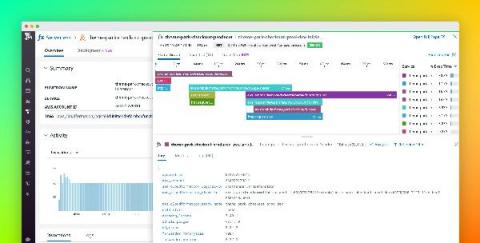
Last year, we released native tracing for AWS Lambda through Datadog APM to provide deep visibility into serverless functions and surface performance issues such as cold starts and errors, without any added latency. But Lambda functions are only one piece of the puzzle in a rapidly growing serverless ecosystem, which includes message queues, data streams, notification services, and more.

Quick Test Feature

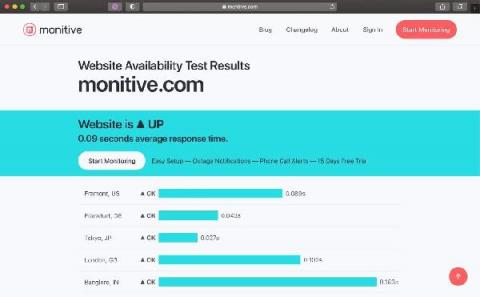
A feature that’s not available in the Monitive service, but has proven to be a useful helper is the ability to quickly check a website from several locations around the world. Just head out to the homepage and type in a website, with or without https://. Press Test Availability and you instantly get an overview of how your website is performing from several locations around the world.