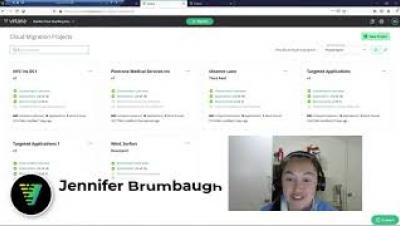
Virtana Migrate update March 2021
Virtana Platform Learning series provides a snapshot into periodic improvements , use cases , features and capabilities.


The latest News and Information on Monitoring for Websites, Applications, APIs, Infrastructure, and other technologies.
One of Sentry’s most-trafficked pages is our issue details page, as it helps our customers understand the root cause an error. For those of you who are new to Sentry, we define an issue as a group of similar events. To render the issue details, a significant amount of data needs to be fetched — counts, charts, event details, and other metadata. The two main components on this page are the latest event, and summary statistics.
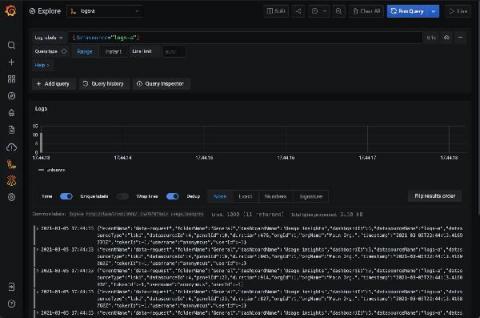
To follow up on our introduction of Grafana Enterprise Logs, the latest addition to the Grafana Enterprise Stack, let’s dig into one of the key features: the admin API and admin plugin. Grafana Loki, Grafana Labs’ log aggregation project, provides the underpinnings of Grafana Enterprise Logs (GEL).
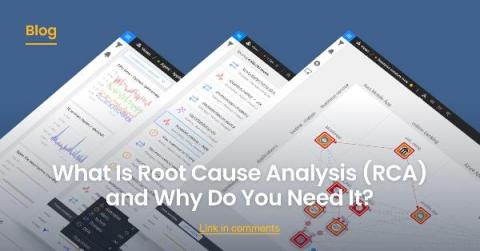
Imagine you have a hole in your car's tire. To fix it quickly and get on your way, you apply a patch. Then it happens again. You apply another patch. Before you know it, you're driving on the highway and you blow a tire. The risk was always there. You were simply hiding it because you didn't solve the problem. We see this often when it comes to IT issues. Teams take a band-aid approach to fixing problems without addressing the underlying causes.
The shift to remote was an unprecedented challenge for most enterprises and businesses. IT operations had to ramp up quickly to maintain processes and workflows. Monitoring tools play a crucial role in enabling ITOps to do everything they need to analyze and resolve incidents quickly.