Operations | Monitoring | ITSM | DevOps | Cloud

The latest News and Information on Monitoring for Websites, Applications, APIs, Infrastructure, and other technologies.

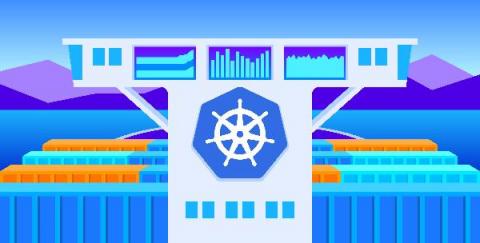
Monitor kube-state-metrics v2.0 with Datadog

In order to manage complex containerized applications, modern devops teams need to have deep visibility into the status of their Kubernetes resources. By listening directly to the Kubernetes API, the open source kube-state-metrics service generates key metrics about your Kubernetes objects, including pods, nodes, and deployments, which are essential for understanding the status and performance of your clusters.
Your thing is Discovery, Discovery: AWS

We will use the powerful Discovery tool to simply configure an AWS (Amazon Web Services) environment, going through all the steps to create a task with the wizard. We will see all agents created thanks to this discovery task, as well as its modules. To finish off, we will focus on Discovery Cloud general view, where we will see expense analysis graphs and a map wth the number of instances per region.

Webinar: Boost up your serverless applications with Amazon EventBridge

EventBridge makes it easy to build event-driven architectures using data from your own applications, Software-as-a-Service (SaaS) applications, and AWS services. In this webinar, AWS Solution Architect Sarah Fallah-Adl, and Lumigo's, Lead Solution Engineer, Timi Petrov, present how to remove the friction of writing "point-to-point" integrations with Amazon EventBridge. They will then share best practices for working with EventBridge and serverless apps.

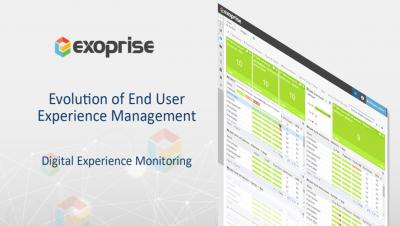
Digital Experience Monitoring Benefits for IT Featuring Forrester

End-User Experience Management (EUEM) is evolving post-Covid-19. Businesses are now moving towards phase 4 of the Covid-19 timeline. This includes understanding remote worker behavior and preparing for the new normal. Technology and IT leaders are increasingly using data to measure the employee experience. According to Forrester, 64% of technology leaders will invest in data and analytics technology to improve remote worker experience. Employees will adopt a hybrid work approach and businesses will want to employ broader employee engagement analysis and understand why a problem is happening at remote locations. Engagement and productivity insights will be delivered via synthetic and real user monitoring for Microsoft 365, Office 365, Teams, and SaaS applications.

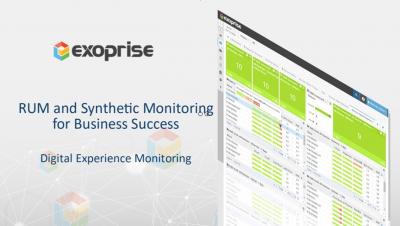
Combine Synthetics and Real User Monitoring for a Complete End-User Digital Experience

Real User Monitoring (RUM) is becoming increasingly popular during the pandemic as most employees start to work remotely from home. This type of passive monitoring approach captures the real end-user experience of accessing web applications. IT gathers SaaS application performance metric data and leverages those insights to quickly troubleshoot issues for remote workers. On the other hand, Synthetic monitoring emulates real users accessing cloud and infrastructure services like Microsoft 365. Businesses would benefit from a holistic monitoring strategy that includes both RUM and Synthetic tests to cater to the needs of a hybrid remote workforce.

Accelerating Code Quality with DORA Metrics

What do Google’s DevOps Research and Assessment (DORA) and Rollbar have to do with each other? DORA identified four key metrics to measure DevOps performance and identified four levels of DevOps performance from Low to Elite. One way for a team to become an Elite DevOps performer is by focusing on Continuous Code Improvement.