Operations | Monitoring | ITSM | DevOps | Cloud

The latest News and Information on Monitoring for Websites, Applications, APIs, Infrastructure, and other technologies.

Automatic creation of monitored objects in Avantra

One of the main development themes for the Avantra 21.11 release was making life easier. This includes using and rolling out Avantra. Our goal is to reduce the effort required on your part and let you focus on the things that are important to you and your business. As a result, Avantra 21.11 comes with a number of improvements to the onboarding process for new systems, and maintaining and updating existing ones. So, let me take you through these new improvements.
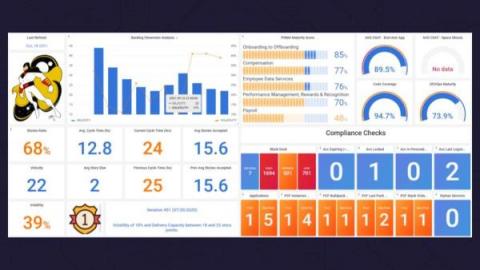
How product teams can manage their performance using Grafana, Prometheus, and Oracle metrics

Ever known a project manager who thinks a task takes minutes when it really takes hours? One company has developed a helpful monitoring tool that not only helps project managers make more realistic estimates, but also helps product teams save time, increase efficiency, and improve their overall performance. At ObservabilityCON 2020, Walter Ritzel Paixão Côrtes, a product designer at Dell, gave a presentation about a data-driven solution his team developed called Product Team Observability.

Historical status data now available

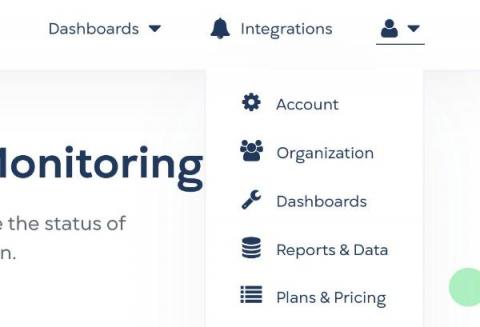
StatusGator customers on our Venture plan have long had access to historical cloud status data. In the past, a simple support request was all it took to get a CSV or JSON feed of any cloud service status data. Now, we’ve brought that data into the StatusGator app itself. A new menu item is now available: Reports & Data. From there, you can choose a data range and download the complete history of all the services in your dashboard: We’d love to know what you think of this feature.

Monitoring Office365 and Azure Health Status with Coralogix

Life is all about perspective, and the way we look at things often defines us as individuals, professionals, business entities, and products. How you understand the world is influenced by many details, or in the case of your application – many data sources. At Coralogix, we not only preach comprehensive data analysis but strive to enable it by continuously adding new ways to collect data.

What InsurTech industry trends to watch for in 2022

In case you missed it, insurtech — technology developed to improve and transform the insurance industry — is having a bit of a moment. Forrester recently reported record-breaking funding for insurtechs, closing Q3 at $15 billion – more funding than in 2019 and 2020 combined – with more deals anticipated by the end-of-year.

Top Data Visualisation Tools (2023 Edition)

If you have been trying to compare all of the best data visualisation tools you may have found it difficult to find a detailed list that includes both open-source and proprietary solutions to help you compare and make an informed decision on what you need going forward. In this guide, you will find out everything you need to know about the leading solutions for data visualisation to help you get started with your next analysis project.

Quarterly Product Update: Better Traces, CONCURRENCY, and RATE

At Honeycomb Developer Week, I got an opportunity to walk through a couple of fun new features we’ve shipped since August and ways that we’ve been able to improve Honeycomb for you. Hearing feedback from our users and customers— through support requests, in the Pollinators community, from Twitter, etc.—helps us make Honeycomb better for you.

Video Observability: Videoconferencing Runs the World-Here's How to Make Sure Yours Keeps Running

When it comes to work, we all know to put our best foot forward. However, as we increasingly rely on videoconferencing in our everyday work life, success also depends on being able to put our best face forward. Unfortunately, that can add up to a headache for IT when it comes to delivering flawless video experiences to a widely distributed workforce.

How to Measure Uptime SLOs Using Pingdom and Nobl9

Do you find yourself asking, “What should our first service-level objective (SLO)be?” The simplest way to get started if you have a website is to measure uptime SLOs. The SLO will measure your uptime and how your site compares to your reliability goals. By following the steps outlined here, you can get up and running with your first SLO in minutes. To get started, you’ll need to set up an account on SolarWinds® Pingdom®.

Future Outlook: AIOps Will Be A Must-Have For Enterprises In 2022

If 2020 was a year of turbulence, 2021 was the year of complete digital transformation. Enterprises across the globe focused their efforts on enabling stellar digital experiences — both to customers and internal stakeholders alike. This had a significant impact on the IT landscape. The number of applications that were ‘mission-critical’ increased overnight. In a recent survey, respondents said that they have an average of 71.4 mission-critical applications.