Operations | Monitoring | ITSM | DevOps | Cloud

The latest News and Information on Monitoring for Websites, Applications, APIs, Infrastructure, and other technologies.

Monitoring AWS EC2 Cloud Instances with AWS CloudWatch

Amazon Elastic Compute Cloud (Amazon EC2) is a web service that provides secure, resizable compute capacity in the cloud. It is designed to make web-scale cloud computing easier for developers. Amazon EC2’s simple web service interface allows you to obtain and configure capacity with minimal friction. It provides you with complete control of your computing resources and lets you run on Amazon’s proven computing environment.

To Mask, or Not to Mask? That Is the Question

While I write this blog post, I reflect on the years of being a system administrator and the task of ensuring that no sensitive data made its way past me. What a daunting task right? The idea that sensitive data can make its way through our systems and other tools and reports is terrifying! Not to mention the potential financial/contractual problems this can cause.

How Product Teams Can Decrease Shopping Cart Abandonment Rate by Improving UX

Checkout optimization can increase conversions by 36% (according to Sleeknote). And if your company struggles with a high cart abandonment rate, you’ll have to work on enhancing your user experience by removing blockers that lead to your customers abandoning their shopping carts. And for that, you will need to leverage qualitative and quantitative user research.

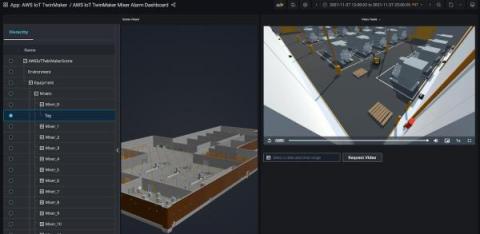
How Grafana powers the dynamic visualizations of IoT data for AWS IoT TwinMaker

At re:Invent this year, AWS announced its new digital twin service, AWS IoT TwinMaker (in preview), which allows users to create digital twins of real-world systems like buildings, factories, industrial equipment, and production lines. Using a digital twin to monitor and improve operations for a physical system requires ingesting data from IoT sensors, process instruments, cameras, and enterprise systems, and curating and associating data from these disparate sources.

New in Grafana Loki 2.4: The Simple Scalable Deployment Mode

New in Grafana Loki 2.4: The Simple Scalable Deployment Mode This mode is a bridge between running Loki as a single binary/monolithic mode and full-blown microservices. The idea is to give users more flexibility in scaling and provide the advantages of separating the read and write path in Loki. Command to run the flog log generator: Start correlating your data with Grafana Cloud and the new FREE tier.

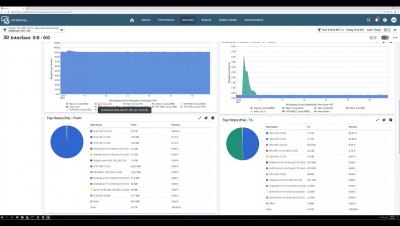
DX NetOps Support for Symantec Secure Web Gateways (SWG)

DX NetOps network monitoring software now supports Symantec Secure Web Gateways (SWG). This short demo shows how the solution can provide visibility for SWGs in the context of your broader network and network delivery strategy. DX NetOps unifies alarms, performance and flow and can help solve key operational challenges for SWGs including event correlation and streamlined ticketing workflows.

New Relic vs. Appdynamics vs. Scout APM

New Relic and Appdynamics were the two most dominating APMs in the software industry some years back. But after the advancement of technology, software monitoring tools started capturing the market. Due to some lack of functionalities, customers have begun switching to different tools because now they have a perfect solution for their particular use case.