Operations | Monitoring | ITSM | DevOps | Cloud
DevOps
The latest News and Information on DevOps, CI/CD, Automation and related technologies.
Integrate with AppDynamics | AppDynamics Demo with Moogsoft | Moogsoft Product Videos & How-Tos
Cluster Monitoring with Prometheus and Rancher
In this article, we present an overview of cluster monitoring using Rancher and Prometheus as well as provide some brief setup tutorials for both tools. We further introduce a metric visualization tool called Grafana that transforms your Prometheus time-series data into graphs and visualizations. MetricFire specializes in monitoring systems. You can use this product with minimal configuration to gain in-depth insight into your environment.
Cycle.io @ KubeCon 2022: Bringing a K8s alternative to the masses!
Detroit, known by its nickname “Motor City'', is a bustling and beautiful city filled with dazzling architecture, food, history, and of course, people.This year, it was home to KubeCon 2022. The city is close to home for Jake and I, 45 minutes from where we started Cycle; it was wonderful seeing how the city has grown the last few years. The art deco style buildings loomed overhead, and the smell of freshly cooked food wafted through the downtown area just outside the venue.
Mobile Cloud Computing: Overview, Challenges and Scope
The process of delivering mobile apps utilizing cloud technology is known as mobile cloud computing (MCC). Complex mobile apps today carry out activities including authentication, location-aware features and providing users with customized communication and content. As long as your device is online, mobile cloud computing enables you to store and access data anywhere. This makes it possible for data to be sent without difficulty anytime required.
GitOps The Planet (E3) | The Open GitOps Project
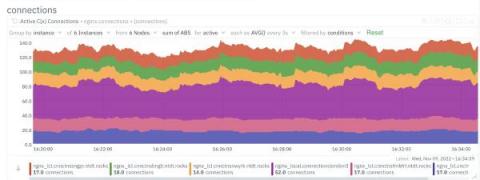
How to monitor NGINX web servers?
Web servers are among the most important components in modern IT infrastructures. They host the websites, web services, and web applications that we use on a daily basis. Social networking, media streaming, software as a service (SaaS), and other activities wouldn’t be possible without the use of web servers. And with the advent of cloud computing and the movement of more services online, web servers and their monitoring are only becoming more important.
How to monitor and troubleshoot Apache web servers
The Apache HTTP Server (Apache HTTPd) is one of the most popular open source web servers available. HTTPd was also the first project developed by the Apache Software foundation which now supports hundreds of well known projects including Kafka, Cassandra and Hadoop. Netdata has a public demo space where you can explore different monitoring use-cases. Check out the Apache demo room to explore and interact with the charts and metrics described here.
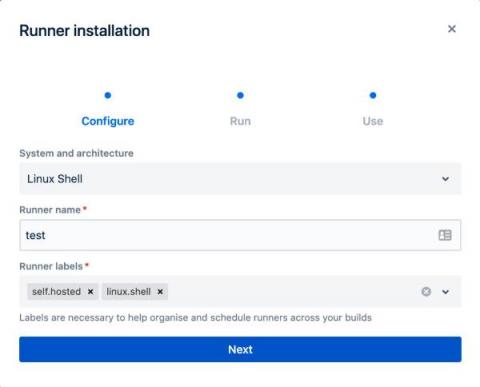
Announcing Linux Shell Runners in Bitbucket Pipelines
Configuring Fargate custom application metrics in CloudWatch using Prometheus
Over the past few months, Helios has experienced rapid growth resulting in our user base increasing, our services multiplying, and our system ingesting more data. Like all tech companies that need to scale, we wanted to avoid our performance becoming sluggish over time.


