Mailchimp
Not subscribed to OpsMatters Newsletter


One of the first considerations for FinOps teams trying to lower their public cloud spend is investing in long-term savings vehicles available from their Cloud Service Provider. These programs can provide customers with upwards of 72% savings off on-demand prices, in return for a 1-to-3-year usage commitment, so it’s pretty common that we see them in use by our customers.
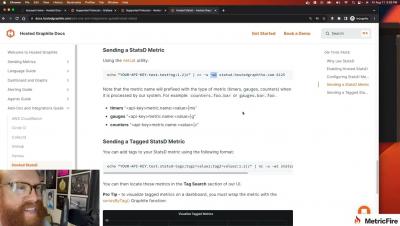
In part I of this blog series, we understood that monitoring a Kubernetes cluster is a challenge that we can overcome if we use the right tools. We also understood that the default Kubernetes dashboard allows us to monitor the different resources running inside our cluster, but it is very basic. We suggested some tools and platforms like cAdvisor, Kube-state-metrics, Prometheus, Grafana, Kubewatch, Jaeger, and MetricFire.
Legacy operations and technology are often unable to support growing organizations, leading to several inefficiencies as business continues to evolve. The way IT teams manage 50 devices will be fundamentally different from the way they manage 500 devices. In response to these evolving business needs, organizations have started looking to process automation to reduce time and money wasted on repetitive, tedious tasks.
Performance monitoring is an essential practice in network monitoring. When something goes wrong with a device, be it a physical server, a network storage system, or a virtual switch, there are often signs or symptoms. These symptoms might display in various places, and they could be related to the CPU, to the hardware, or maybe bandwidth usage. Only by tracking them can you be aware of performance issues.