Grafana 7.0 sneak peek: query history in Explore
Grafana 7.0 is coming in May! In the next days and weeks before it launches during GrafanaCONline, we'll be posting sneak previews of new features.


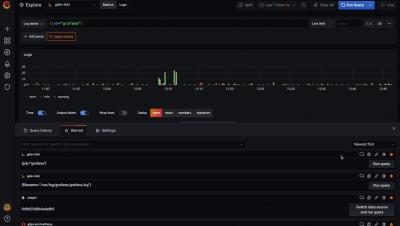
Grafana v7.0 is coming next month! Here’s a sneak peek of one of its features: the query history in Explore. Query history lets you view the history of your querying. All queries that have been starred in the Query history tab are displayed in the Starred tab. This allows you to access your favorite queries faster and to reuse these queries without typing them from scratch.
Amazon Web Services (AWS) products are countless, and at LogicMonitor, we are working tirelessly to bring monitoring support to as many of them as possible. With so many products and tools already on your plate, we want to make sure that monitoring is not a hassle, but rather a trusted companion. Here, we will focus on the analytics section of AWS and provide some tips on how to utilize the data collected from AWS Athena and Glue.
With more and more businesses moving into the cloud, many of us are increasingly faced with the need to monitor our Azure applications in Azure Monitor – but where to start? If you’re feeling lost or overwhelmed by the platform’s sheer range of functionality, you’re not alone, and we’ve got some useful resources for you.
Today, I’m excited to announce the Open Observability Conference – a virtual event on May 27th at 11:00am EDT providing a platform for learning, sharing and discussion of open source observability technologies for DevOps teams around the globe. Register for the Open Observability Conference here.