Kubernetes just celebrated its tenth birthday. That’s 10 years of microservices, containers, service meshes, and many other paradigms that are now common to many developers’ toolkits.
Static code analysis is an important part of testing your software to ensure it is release-ready. In contrast to dynamic testing, which involves executing your code to find errors, static analysis uses automated tools to “look” through the code, without executing it, to find potential errors (including potential security issues) and bugs. Since the code does not need to be executed, static testing can begin much earlier in development than dynamic testing.
In March 2023, Hewlett Packard Enterprise (‘HPE’) announced the acquisition of OpsRamp, subsequently closing the deal in May that year. Founded in 2014, OpsRamp is an award-winning solution that enables IT operations, site reliability engineeering (SRE), cloud operations, and DevOps teams, and other stakeholders to better detect, remediate, predict, and prevent slowdowns and outages across physical, virtual, and cloud systems.
When systems fail, it's not just a technical hiccup – it's a business problem. Downtime means unhappy customers and lost revenue. That's why teams need effective ways to spot issues fast and fix them even faster. This is where monitoring and observability come into play. Monitoring and observability are two key approaches to keeping your systems running smoothly. Monitoring is like your system's alarm bell – it tells you when something's wrong.
System logging protocol, abbreviated as Syslog, is a standard protocol used for message logging. Put simply, it is a standard for collecting and storing log information. A Syslog server collects, parses, stores, examines, and dispatches log messages from devices including routers, switches, firewalls, Linux/Unix hosts, and Windows machines.
As a CTO stepping into the fast-paced world of startups or scaling tech organizations, one of your first and most critical tasks is to chart a clear DevOps roadmap. This roadmap isn’t just a technical guideline—it’s a strategic blueprint that aligns your tech initiatives with your business goals. To succeed, your approach needs to be systematic, focusing on immediate wins while building a foundation for long-term scalability and resilience.
Incidents are inevitable. No matter how well-prepared your team is, something will eventually go wrong. But what separates high-performing IT teams from the rest is how they handle these incidents after the dust settles. Enter the Post-Incident Review (PIR) in Incident Management—a crucial process that not only helps teams understand what went wrong but also ensures that they’re better prepared next time.
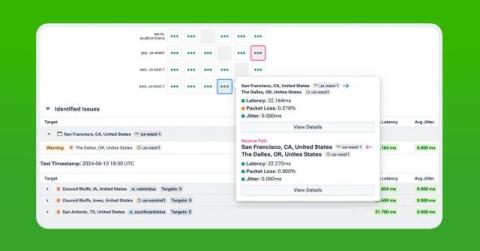
In this post, explore the challenges of diagnosing network traffic blockages in AWS due to the complex and dynamic nature of cloud networks. Learn how Kentik addresses these issues by integrating AWS flow data, metrics, and security policies into a single view, allowing engineers to quickly identify the source of blockages enhancing visibility and speeding up the resolution process.
Learn how to cut IT observability costs with OpenTelemetry. We'll cover ways to streamline data collection, reduce hidden expenses, and optimize data management. Discover practical tips for handling telemetry data efficiently, avoiding vendor lock-in, and improving system performance. Watch this video for actionable insights and real-world examples of using OpenTelemetry to manage costs effectively.