Operations | Monitoring | ITSM | DevOps | Cloud
Dashboards
Introducing New Storage Dashboards in the Cloud Monitoring Console (CMC)
Monitoring and gaining additional insights about usage of your Splunk Cloud Platform deployment is essential for effective management as a Splunk admin. Your Splunk Cloud comes with the Cloud Monitoring Console (CMC) app, which displays relevant information about the status of your Splunk Cloud environment using pre-built dashboards.
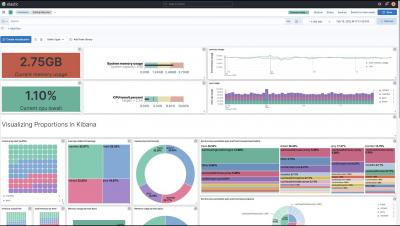
8 ways to visualize proportions in Kibana
How to monitor your Apache Spark cluster with Grafana Cloud
Here at Grafana Labs, when we’re building integrations for Grafana Cloud, we’re often thinking about how to help users get started on their observability journey. We like to focus some of our attention on the different technologies you might come across along the way. That way, we can share our tips on the best ways to interact with them while you’re using Grafana Labs products.
Splunk UI and the Dashboard Framework: More Visual Control Than Ever
If you attended.conf21, or followed any Splunk blogs by Lizzy Li for the past year, then you likely have heard of Splunk Dashboard Studio — our new built-in dashboarding experience included in Splunk Enterprise 8.2 and higher and Splunk Cloud Platform 8.1.2103 and higher. With new, beautiful visualizations and the ability for more visual control over the dashboard, our customers and Splunkers alike have been creating beautiful and insightful dashboards to turn data into doing.
Intuitive Kibana Dashboards for Microsoft Teams User Metrics at your Fingertips - Martello Vantage DX Feature Spotlight
It is no secret that for IT teams, troubleshooting Microsoft 365 or Microsoft Teams issues takes time, and more often than not, the culprit is not even Microsoft.
On the Brittleness of Dashboards
Dashboards are one of the most basic and popular tools software engineers use to operate their systems. In this post, I'll make the argument that their use is unfortunately too widespread, and that the reflex we have to use and rely on them tends to drown out better, more adapted approaches, particularly in the context of incidents.
Virtualization Management: What It Is, What It Does, and How It Can Streamline Your Dashboard
Let’s say that you’re a real estate investor with lots of buildings in your portfolio. But you choose not to employ a caretaker when you fully know that you aren’t always available to monitor every building. What do you think will become of some of them?
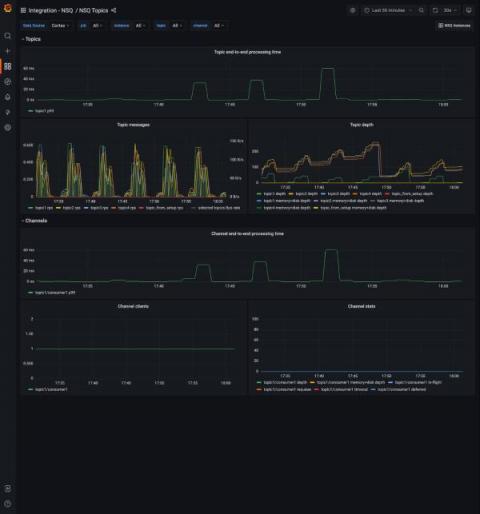
Monitor real-time distributed messaging platform NSQ with the new integration for Grafana Cloud
Today, I am excited to introduce the NSQ integration available for Grafana Cloud, our platform that brings together all your metrics, logs, and traces with Grafana for full-stack observability. NSQ is a real-time distributed messaging platform designed to operate at scale, handling billions of messages per day. It’s a simple and lightweight alternative to other message queues such as Kafka, RabbitMQ, or ActiveMQ. This will walk you through how to get the most out of the integration.


