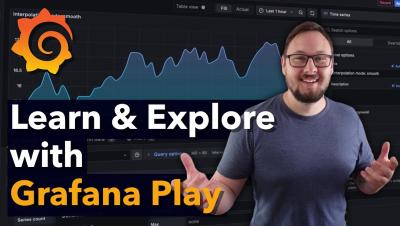
Operations | Monitoring | ITSM | DevOps | Cloud

Dashboards

Introducing Grafana k6 Cloud for Education, a free program to help teach performance testing

Grafana k6 is our open source tool to help you ship reliable applications by doing performance testing in a modern and developer-friendly way. Performance testing is still unknown to many, but it is not a new topic. In fact, performance testing courses are everywhere — even at colleges and universities. One of our passions is to educate others on the best practices of performance testing, working together with the Grafana k6 community.

Updates to Dashboards and Stats

Between planning, triaging tickets, negotiating requirements with external stakeholders, and actually building software, it’s hard to take the time to make dashboards or even think about the most important metrics your team needs to track. To make it easier for you to get insights into your team effectiveness and project health, we made a few updates to Dashboards and Stats that you just might like.

What are cardinality spikes and why do they matter?

At Grafana Labs, we spend a lot of time talking to our customers, and something we’ve heard from people in a wide range of organizations is that they want to be able to better manage sudden spikes in cardinality. Here we will give you a basic overview of what cardinality is and why it’s an important factor in your observability setup, especially when there is a dramatic uptick.

Learn how to get started with Grafana Cloud, Grafana OnCall, Grafana Tempo, and the Grafana Stack

Are your metrics, logs, and traces playing hard to get in your current observability setup? Feel like your on-call messages are left on read? Is the heatmap between your data sources fizzling out on your dashboard?

Dashboard Fridays: Sample SQL AdventureWorks Dashboard

Join Adam Kinniburgh and Shawn Williams in this latest Dashboard Fridays episode on SQL AdventureWorks. Microsoft provides a common dataset called AdventureWorks when learning how to use SQL Server. Using SquaredUp, the AdventureWorks dataset can easily be visualized in any organization. In this short video, we'll demonstrate how this dashboard was built using SquaredUp dashboards, the challenges it solves, and how you can easily replicate it in your own environment.

Transforming application logs into metrics with Istio and Grafana Cloud

Do you actually know what your customers are looking for? A way to uncover new business opportunities is to analyze your system, collect what you really need, and visualize it through a comprehensive graph! Log traces are a great place to start because they usually contain useful information on your customers' interests. You just need to transform them.

Bootstrapping a cloud native multi-data center observability stack

Bram Vogelaar is a DevOps Cloud Engineer at The Factory, and he recently delivered an intro to observability talk during our Grafana Labs' EMEA meetup. When I talk to customers, they might tell me about how their applications are running in two data centers, but when we probe a little further, it turns out that their observability stack is only available in one of them. This revelation hit close to home last March.

New release: SquaredUp 5.4 - Bring your answers to the surface

SquaredUp 5.4 is here and it’s got some brilliant new features and upgrades to help you troubleshoot and find answers faster than ever. You’ll find the upgrades across all three SquaredUp editions – for SCOM, Azure, and the free Community Edition. Here are the highlights in the new release: Check out our release webinar for a detailed walkthrough and demo.

Dashboard Fridays: Sample au2mator Services Dashboard

Our au2mator customers heavily use the au2mator Self Service Portal to present automation as a delegated task to the Service Desk, Users, and Admins. This dashboard shows how au2mator were able to visualize all their services within a single SquaredUp dashboard. Using SQL, PowerShell, Azure Log Analytics, and Web Content, au2mator made a dashboard that looks simple but visualizes a lot. Join Adam Kinniburgh and special guest Michael Seidl from au2mator as they demonstrate how this dashboard was built, the challenges it solves and how you can get the dashboard pack!