Understand your Kubernetes cost drivers and the best ways to rein in spending
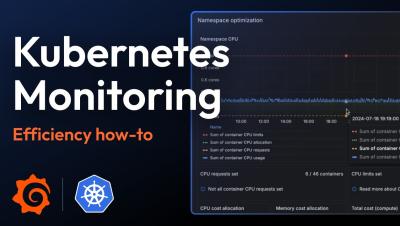
In the previous blog post in this two-part series, we discussed the critical signals you need to monitor in your Kubernetes environment to ensure optimal resource provisioning. These signals include high CPU and memory utilization, frequent pod evictions, slow application performance, and other indicators that your resources are over- or under-provisioned. Monitoring these signals is essential for maintaining an efficient, cost-effective, and environmentally sustainable Kubernetes environment.