Operations | Monitoring | ITSM | DevOps | Cloud

Dashboards

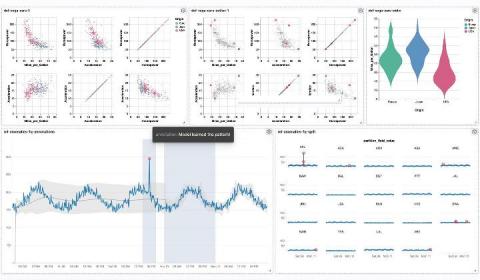
How to bring Jupyter Notebook visualizations to Kibana dashboards with Vega

In this blog post you’ll learn how to create visualizations for Kibana dashboards from Jupyter Notebooks. The good news for you as a Python developer: You won’t have to spend time writing cumbersome plain JSON documents or even JavaScript code. Under the hood, we’re going to make use of Kibana’s Vega plugin which became generally available with Elastic Stack 7.10.

The 'What' and The 'How' of an Effective Monitoring Dashboard

The Network Monitoring Dashboard is critical for your users to process, interact with, and analyze data. While most enterprise teams understand the essentiality of dashboards, they often fail to maintain the efficacy of a well-designed dashboard. A common phenomenon among dashboards is that even the most sophisticated-looking dashboards, embedded with colorful graphics, can be deceptive and uninformative for the decision-making process.

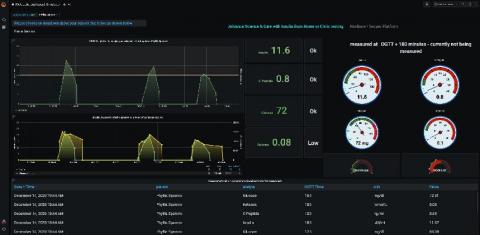
How Grafana is helping the DIFFERENCE Foundation visualize medical data in their fight against a global pandemic

The DIFFERENCE Foundation is a non-profit organization based in the Netherlands that is focused on designing, guiding, and funding highly quantitative research on metabolic dysfunction. The foundation considers metabolic dysfunction—which can trigger obesity, diabetes, many other diseases—the original global pandemic, as it affects almost one quarter of the global population.

Dashboards and visual consoles Workshop | Pandora FMS

We will design customized screens offering specific information in a fully customized format, using Pandora FMS online editor: Graphs and data combined, perfect to share with your team. With the dashboards, you will be able to define screens for monitoring and share them with others, or show them in full screen for the whole team to see.

A Step-by-Step Guide to Building Modern Dashboards on the Orion Platform - SolarWinds Lab #93

Turning data into information and information into decisions are some of the most common challenges facing any monitoring professional. A clean, easy-to-interpret dashboard can go a long way in turning those raw numbers into actionable decisions. In this heavily requested follow-up episode, Kevin M. Sparenberg, technical content manager for THWACK®, presents a step-by-step build for modern dashboards.

The 7 cultural values that drive Grafana Labs

At Grafana Labs, we believe that our culture is one of the differentiators that make us an extraordinary company. In the middle of a pandemic, we’ve been in the very fortunate position to be in a high-growth phase: We’ve expanded the team by 118% this year, and our headcount just tipped over 250 global Grafanistas.

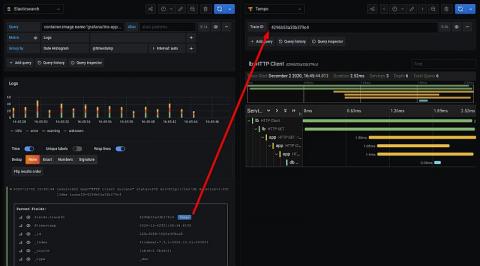
How to find traces in Tempo with Elasticsearch and Grafana

Grafana Tempo, the recently announced distributed tracing backend, relies on integrations with other data sources for trace discovery. Tempo’s job is to store massive amounts of traces, place them in object storage, and retrieve them by ID. Logs and other data sources allow users to quickly and more powerfully jump directly to traces than ever before. Previously we investigated discovering traces with Loki and exemplars.

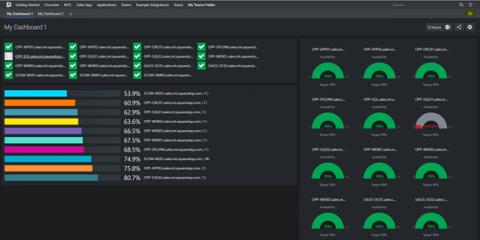
Control access with Teams Folders

If you work in monitoring, you know how important it is for the right people to see the right data. Too much irrelevant data creates a flurry of alerts that hinders productivity, and missing out on key data leads to visibility issues. Worst of all is when you get the wrong people tinkering with data that belongs to other teams.

Bigger is Better with Splunk TV: Highlights of .conf20

Last year at .conf19, we announced the GA release of Splunk TV, our free app for Apple TV that provides users with a secure, reliable, read-only platform to display Splunk dashboards on their TVs. Splunk TV was built with security in mind, to power your SOCs and NOCs. Using Splunk TV instead of running dedicated computers to power each screen saves money and increases security. The read-only experience eliminates the risk of someone with physical access tampering with your environment.

Kibana Canvas: An In-Depth Guide

When we look at information, numbers, percentages, statistics, we tend to have an easier time understanding and interpreting them if they’re also represented by corresponding visual cues. Kibana Canvas is a tool that helps us present our Elasticsearch data with infographic-like dashboards – fully visual, dynamic, and live.