Operations | Monitoring | ITSM | DevOps | Cloud
Lessons learned from integrating OpenAI into a Grafana data source
Interest in generative AI and large language models (LLMs) has exploded in popularity thanks to a slew of announcements and product releases, such as Stable Diffusion, Midjourney, OpenAI’s DALL-E, and ChatGPT. The arrival of ChatGPT in particular was a bellwether moment, especially for developers. For the first time, an LLM was readily available and good enough that even non-technical people could use it to generate prose, re-write emails, and generate code in seconds.
What on earth are DORA Metrics?
If you take a glance at LinkedIn, Twitter, or any tech-focused social content these days you're bound to see people talking about something called "DORA metrics". So what are DORA metrics? What value do they provide? And how can you get started with them?
How to monitor your Apache Mesos clusters with Grafana Cloud
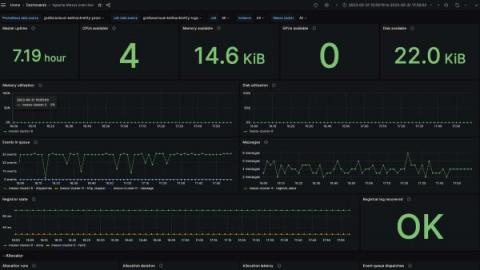
We’re excited to introduce a dedicated Grafana Cloud solution for Apache Mesos, an open-source project for managing clusters in your data center and at cloud scale. Apache Mesos is a distributed systems kernel, running on every machine in a cluster and providing easy orchestration of every resource in the cluster. This allows you to treat compute units, memory, and disk as a single pool of resources.
How Worldline uses Grafana Enterprise and Grafana Mimir to run its platform-as-a-service at a global scale
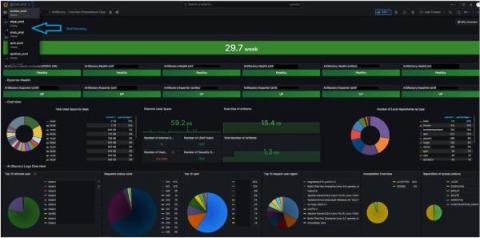
According to the World Bank, two-thirds of adults around the globe currently make or receive digital payments. Businesses have come to expect quick, reliable processing, and one company at the forefront of that is Worldline. The global payment service provider (PSP) is a leading payment processor and payment provider in Europe, with about 3.4 billion e-commerce transactions made in 2022.
Dashboard Fridays: Steam Player Data
A practical guide to data collection with OpenTelemetry and Prometheus
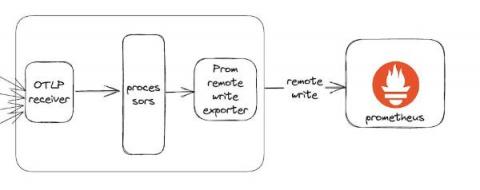
Grafana Labs has always been actively involved in the OpenTelemetry community, even working with the predecessor projects OpenTracing and OpenCensus. We have been supporting OTLP as the primary input protocol for our distributed tracing project, Grafana Tempo, since its inception, and our Grafana Agent embeds parts of the OpenTelemetry Collector.
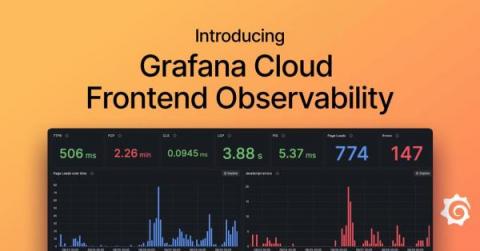
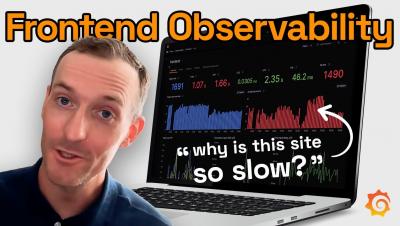
Real user monitoring in Grafana Cloud: Get frontend error tracking, faster root cause analysis, and more
The frontend of a web application is the part that users directly interact with. It’s the last mile of the digital service you deliver to your customers and it’s directly associated with customer satisfaction and business objectives. Knowing performance metrics such as CPU or memory is helpful, but at the end of the day, what you care most about is if the user experience is affected.


