Operations | Monitoring | ITSM | DevOps | Cloud

Tracing

The latest News and Information on Distributed Tracing and related technologies.

OpenTracing for Go projects

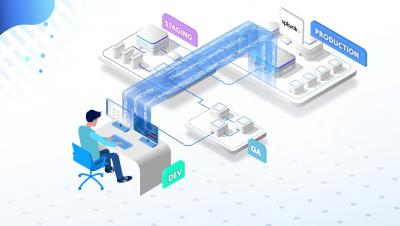
Large-scale cloud applications are usually built using interconnected services that can be rather hard to troubleshoot. When a service is scaled, simple logging doesn’t cut it anymore and a more in-depth view into system’s flow is required. That’s where distributed tracing comes into play; it allows developers and SREs to get a detailed view of a request as it travels through the system of services.

How Grafana Labs enables horizontally scalable tail sampling in the OpenTelemetry Collector

Tracing is a widely adopted solution to provide performance insights into distributed applications. It is a valuable resource for developers to view the service call graph and track service latency at a granular level. It’s also a handy tool for on-call engineers to drill down and debug a problematic service during an outage. There are a number of open source distributed tracing frameworks out in the wild, including Jaeger, Zipkin, and OpenTelemetry.

Combining AIOps Methods with New Approaches to Distributed Tracing

Humans are naturally visual creatures. Several of us are visual learners, meaning, we learn by seeing things in action. Tracing is seeing things in action. Troubleshooting where and why something is slow or flat out broken, with clear visual indication, is incredibly powerful.

Tracing Tools Compared: Jaeger vs. OpenTracing

With the advent of microservices, technologies like Docker, Kubernetes and services like Cloud Computing, have showcased the broader need for observability. Collecting valuable information about the communication endpoints and how they propagate through the discrete components of the application stack is the key to understanding when, why and what happens in case of failure.

Jaeger Essentials: Performance Blitz with Jaeger

I’d like to share some of the best practices we’ve learned on our journey to battle performance issues with the Jaeger tracing tool. Some may say we are experts in logging. We log for a living, and have our log analytics service (which we based on open source ELK Stack) to prove it. We’ve mastered logging to the level where debugging and troubleshooting our system is a no-brainer.

Integrating Traces and Logs with OpenTelemetry - Stack Doctor

Tracing is a great way to monitor your services, but how does one go about fixing latency issues in a specific service? In this episode of Stack Doctor, Yuri Grinshteyn shows you how to connect traces with logs via OpenTelemetry and Cloud Trace and Logging, enabling you to pinpoint and debug service latency issues in a snap!

Jaeger clients and W3C Trace-Context

In this article, we are going to have a look at using Jaeger clients with W3C Trace-Context propagation format. The standardized context propagation format assures interoperability between different tracing systems and instrumentation libraries. In this regard we are going to explore two use cases. First how to use OpenTelemetry SDKs in Jaeger instrumented environment.

New in Grafana 7.0: Trace viewer and integrations with Jaeger and Zipkin

Moving to a scalable, distributed microservice architecture poses a great deal of challenges for any organization. It gets harder to understand the system and pinpoint where errors originate. Logs get much messier, and stitching together a coherent picture of a particular request can be time-consuming or downright impossible. Distributed tracing can help with all of that.