Operations | Monitoring | ITSM | DevOps | Cloud

Tracing

The latest News and Information on Distributed Tracing and related technologies.

Logging + Trace: love at first insight

Meet Stackdriver Logging, a gregarious individual who loves large-scale data and is openly friendly to structured and unstructured data alike. Although they grew up at Google, Stackdriver Logging welcomes data from any cloud or even on-prem. Logging has many close friends, including Monitoring, BigQuery, Pub/Sub, Cloud Storage and all the other Google Cloud services that integrate with them. However, recently, they are looking for a deeper relationship to find insight.

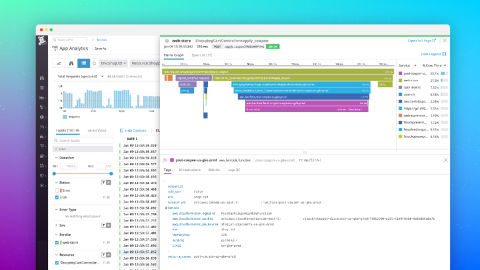
Distributed tracing for AWS Lambda with Datadog APM

Since AWS Lambda was launched in 2014, serverless has transformed the way applications are built, deployed, and managed. By abstracting away the underlying infrastructure, developers are able to shift operational responsibilities to the cloud provider and focus on solving customer problems.

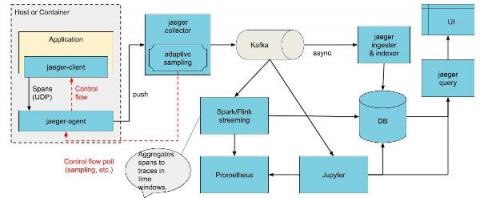
Data analytics with Jaeger aka traces tell us more!

I will get straight to the point, Jaeger at the moment only visualizes collected data from instrumented applications. It does not perform any post-processing (except service dependency diagram) or any calculations to derive other interesting metrics or features from traces it collects. This is a pity because traces contain the richest information from all telemetry signals combined!

Why Transaction Tracing is Critical for Monitoring Microservices

Teams switching from a monolithic application architecture to microservices often face a jarring realization: their time-tested troubleshooting techniques don’t work as effectively. A microservice consists of many independent, distributed, and ephemeral services with varying capabilities for monitoring and logging. Techniques such as stack traces are effective troubleshooting tools in monoliths, but only paint a small portion of the big picture in a microservice-based application.

Getting At The Good Stuff: How To Sample Traces in Honeycomb

(This is the first post by our new head of Customer Success, Irving.) Sampling is a must for applications at scale; it’s a technique for reducing the burden on your infrastructure and telemetry systems by only keeping data on a statistical sample of requests rather than 100% of requests. Large systems may produce large volumes of similar requests which can be de-duplicated.

Instrumenting Lambda with Traces: A Complete Example in Python

We’re big fans of AWS Lambda at Honeycomb. As you may have read, we recently made some major improvements to our storage engine by leveraging Lambda to process more data in less time. Making a change to a complex system like our storage engine is daunting, but can be made less so with good instrumentation and tracing. For this project, that meant getting instrumentation out of Lambda and into Honeycomb.

KubeCon Demo: A Preview of Grafana & Jaeger

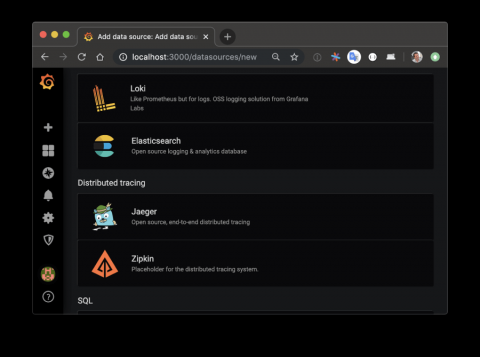
At the Grafana Labs booth at KubeCon + CloudNativeCon in San Diego this week, we showed a demo of a future feature for Grafana: distributed tracing datasources. Until now, Grafana has been bringing together metrics and logs, to be viewed side-by-side on one screen. Now we’re adding tracing, which has been a missing puzzle piece for even more observability in Grafana.

OpenTelemetry, OpenTracing, OpenCensus: An Introduction and Glossary

There’s been a fair bit of buzz lately about OpenTelemetry, which is the next major version of the OpenTracing and OpenCensus projects. The leadership of those two projects have come together to create OpenTelemetry, which combines the best parts of OpenTracing and OpenCensus to create one open source project to help with your instrumentation needs.