Operations | Monitoring | ITSM | DevOps | Cloud

RUM

Gain actionable insights with real user monitoring: the latest features in Grafana Cloud Frontend Observability

One of the biggest challenges observability teams face today is gaining end-to-end visibility into their cloud native apps, including modern browser frontends. Without that visibility, you potentially open the door to bad end-user experiences that can hurt customer satisfaction, reduce search engine discoverability, and interfere with overall business goals. This is the exact challenge we address with Grafana Cloud Frontend Observability.

Introducing Mobile Real User Monitoring (RUM)

Human attention spans are seemingly shorter than ever, and your mobile application users are, unfortunately, no exception. Over 70% of users abandon an app if it’s taking too long, with half of these users waiting no more than three seconds. Even minor delays or errors can lead to significant user drop-off, negatively impacting your app’s success and user satisfaction.

Teams V2 Synthetics and Real-User Monitoring Support

With the release of Microsoft Teams 2.0 and the Classic Teams client nearing its EOL (end of life), we were eager to explore the changes that Teams 2.0 brought about. Today we will look into the new features and architecture of Teams 2.0 as well as provide insight into the changes and improvements to the CloudReady Teams Messaging and Teams AV sensors.

API update: Sessions, pages and Customers

Today, we’re excited to roll out 6 new endpoints for the Raygun API, making it simpler than ever to query Sessions, Pages, and Customers. Raygun’s Real User Monitoring helps you track and enhance your front-end and mobile page speed performance. It analyzes user sessions and page views to calculate your overall page speed. Previously, this required someone to log into Raygun, find the right application, and manually inspect sessions and page views in Real User Monitoring.

The Leading Real User Monitoring Tools

Utilizing real-user metrics from your applications frontend can provide a significant advantage to your company. Real user metrics offer insights into how users interact with your product or service. By monitoring metrics like page load times, response times, and overall performance, you can highlight areas where users could be experiencing frustration or encountering problems. This information can then be utilized to make targeted improvements to enhance the user experience.

Build Dashboards for Monitoring the Remote Workforce

Remote workforce management is driving the business landscape, requiring cloud-based tools for monitoring to maintain productivity and user satisfaction. Real-User Monitoring (RUM) and synthetic transaction monitoring are powerful tools that enable organizations to diagnose and fix network issues faster for their employees wherever they work.

Real User Monitoring Report

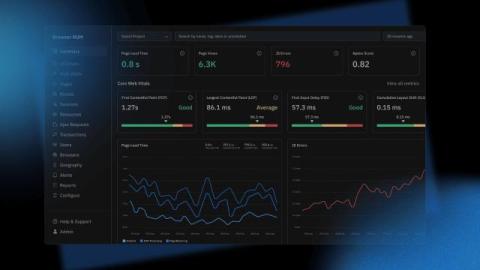
Take an in-depth tour of the Uptime.com RUM report. Comprehensively understand your users – and your baselines. Organize RUM data by URL(s) or group URL(s) to track subdomains; segment data by devices, operating systems, browsers, countries, other geographies – to compare metrics within specific time windows to your website or application’s performance monitoring baselines.

What is Real User Monitoring (RUM)? A Comprehensive Guide

Today, more than 90% of businesses use digital platforms to sell their services and products online. But what if despite getting high traffic from different sources your sales count is below your expectations? What if customers are visiting your product page but exit before making any purchase? Well! To get more insights into the performance issues and user experience, many businesses have started investing in a real user monitoring tool that captures all details related to user behavior and experience.