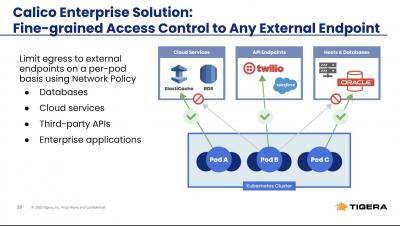
Managing IT infrastructure today can feel like a game of Tetris. Operations staff are constantly managing the addition of new pieces, trying to quickly determine how to best position them while the clock is ticking before the next round drops. Ultimately, decisions made early on impact what comes later and vice versa.
When an outage hits your service, everybody starts talking. Your engineers are talking about what caused the problem, and how to fix it; your management is asking about when it’ll be fixed; and your customers are telling the world that they’re not happy. But there’s an even more important conversation you should be having: communicating with your users about the issue.
In today’s enterprises, DevOps isn’t one process, but many thinly connected tasks. A stack of DevOps tools that need to work together to operate as a single system, each one requiring its own integration and maintenance. The JFrog DevOps Platform unifies our industry-leading products because DevOps has a single goal: to speed releases from code to production. It takes several tools to build DevOps, but DevOps tools need to function as one.
Most of us are familiar with the traditional farms that have existed since humans learned to sow and harvest crops—these farms have provided us with food for centuries. And for a long time, due to the lack of refrigeration and other technology, humans lived near their food sources. But industrialization has also led to centralization of farming systems, with farms getting larger and further from consumers and with distributors depending on preservatives or refrigeration to extend shelf life.
To have Observability is to have the ability to understand your system’s internal state based on signals and externally-visible output. Honeycomb’s approach to Observability is to strive toward this: every feature of the product attempts to move closer to a unified vision of figuring out what your system did, and how it got there.
Logstash is an open source data processing pipeline that ingests events from one or more inputs, transforms them, and then sends each event to one or more outputs. Some Logstash implementations may have many lines of code and may process events from multiple input sources. In order to make such implementations more maintainable, I will show how to increase code reusability by creating pipelines from modular components.
Having spoken with many companies, I’ve learned that while they all monitor their application performance, infrastructure, product usage, conversion rates and a variety of other user experience parameters, very few monitor the actual transactions from their payment provider.
IT operations management vendors are adding AI capabilities to their wares, but central AIOps platforms deliver the most value by coordinating all those domain-specific tools.
In this article we will look at the agent-like instrumentation tool T-Trace. The tool provides non-intrusive instrumentation capabilities for applications running on GraalVM. We will instrument a simple NodeJS application by using T-Trace and OpenTracing API with Jaeger NodeJS tracer.