Operations | Monitoring | ITSM | DevOps | Cloud

Monitoring

The latest News and Information on Monitoring for Websites, Applications, APIs, Infrastructure, and other technologies.

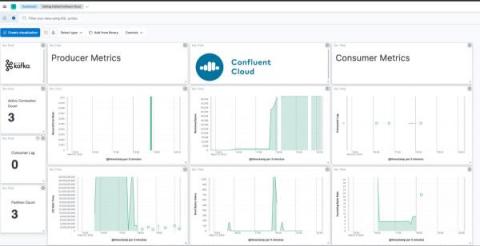
How to monitor Kafka and Confluent Cloud with Elastic Observability

The blog will take you through best practices to observe Kafka-based solutions implemented on Confluent Cloud with Elastic Observability. (To monitor Kafka brokers that are not in Confluent Cloud, I recommend checking out this blog.) We will instrument Kafka applications with Elastic APM, use the Confluent Cloud metrics endpoint to get data about brokers, and pull it all together with a unified Kafka and Confluent Cloud monitoring dashboard in Elastic Observability.

Continuous Monitoring: 5 Tools to Give You Peace of Mind

If you’re part of the DevOps, SecDevOps, or IT team, you would agree that continuous monitoring of the entire IT systems and networks is vital. And this explains why 70% of businesses treat preventing downtime as a priority to avoid causing significant issues in the future. So monitoring your IT infrastructure constantly with a continuous monitoring plan is one way of improving efficiency and productivity.

Platform Engineering 101: Origins, Goals, DevOps vs SRE & Best Practices

Platform engineering is the practice of automating infrastructure operations and enabling self-service infrastructure capabilities within collaborative Dev, Ops and QA teams. It involves designing and building platforms, technologies and workflows that enable self-service capabilities to automatically manage, provision and operate complex modern software architecture environments.

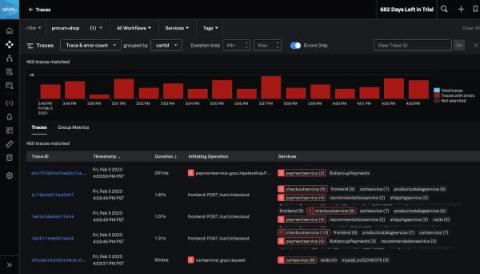
New APM Capabilities Help Optimize Application Performance Across Monoliths or Microservices

With the goal of helping you get to the “why” faster, Splunk Observability recently announced several new enhancements to reduce noise and provide more visibility when isolating problems in your environments. Specific to applications and services, whether you operate monolithic or microservices architectures our releases help you easily investigate problems in complex environments. Here’s a roundup of the recent Splunk APM capability releases, and helpful links to help get started now.

When Slow is Not an Option: How to Improve & Troubleshoot Your SAP Speed Performance

SAP (Systems, Applications, and Products) is a popular enterprise resource planning (ERP) software used by businesses to manage various operations such as finance, human resources, and supply chain management. As businesses rely on SAP for their critical operations, it is essential that the software performs at an optimal level. Slow SAP performance can result in frustration, delays, and ultimately, reduced productivity.

Python OpenTelemetry - Walkthrough and monitoring Examples

Microservices architecture has become the new norm for modern applications due to its numerous advantages compared to traditional monolithic architecture. However, microservices also come with several challenges. Especially when it comes to observability, traditional monitoring tools and techniques can no longer handle microservices’ distributed and dynamic nature.

Anomaly Detection Using OSquery and Grafana

Detecting unauthorized usage and malicious applications in an instance involves analyzing OS and application logs. Doing this manually is a herculean effort because of the number of logs and the patterns one has to look for. Having a tool that can provide an aggregated view of your instance and the ability to analyze them easily can greatly reduce manual effort.

Quantum Entangled Observability

As the world of technology continues to evolve, the demand for cutting-edge solutions to monitor and optimize system performance has never been higher. Today, we’re excited to introduce a revolutionary new concept in observability: Quantum Entangled Observability (QEO). This ground-breaking method leverages the peculiar properties of quantum mechanics to provide unparalleled insights into your systems’ inner workings.