Operations | Monitoring | ITSM | DevOps | Cloud
Monitoring
The latest News and Information on Monitoring for Websites, Applications, APIs, Infrastructure, and other technologies.
Our Favorite Grafana Dashboards
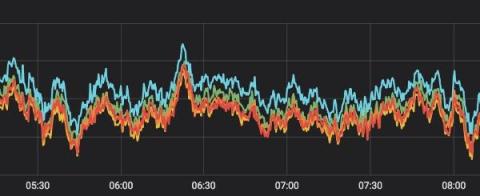
Grafana is an open-source visualization and analytics tool that lets you query, graph, and alert on your time series metrics no matter where they are stored - Grafana dashboards provide telling insight into your organization. All data from Grafana Dashboards can be queried and presented with different types of panels ranging from time-series graphs and single stats displays to histograms, heat maps, and many more.
How to securely send your telemetry to Grafana Cloud using AWS PrivateLink
Using Grafana Cloud to manage and monitor even your most sensitive data from your AWS services just got easier. If your organization’s workloads are hosted in AWS and you are using a Grafana Cloud instance that’s also hosted in AWS, you can now use AWS PrivateLink to establish a secure connection between your virtual private cloud (VPC) network and Grafana Cloud for all your data.
Upgrade to DX UIM 20.4 CU9 to Leverage New Features and Security Updates
DX Unified Infrastructure Management (DX UIM) is a powerful solution that enables comprehensive infrastructure observability across your digital ecosystems, including private, public, and hybrid clouds. With DX UIM, you can proactively and efficiently manage the performance and availability of your IT infrastructure and applications. DX UIM 20.4 is the current main branch of the solution. This release offers a number of significant capabilities that weren’t available in earlier versions.
Monitoring your infrastructure with StatsD and Graphite
Collecting metrics about your servers, applications, and traffic is a critical part of an application development project. There are many things that can go wrong in production systems, and collecting and organizing data can help you pinpoint bottlenecks and problems in your infrastructure. In this article, we will discuss Graphite and StatsD, and how they can help form the basis of monitoring infrastructure.
AWS Performance Monitoring with Kentik
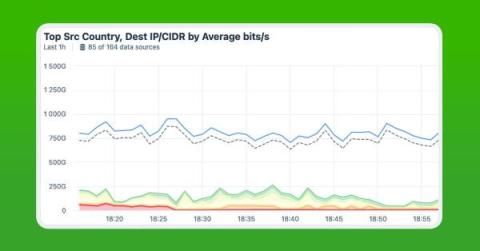
CloudWatch can be a great start for monitoring your AWS environments, but it has some limitations in terms of granularity, customization, alerting, and integration with third-party tools. In this article, learn all the ways that Kentik can supercharge your AWS performance monitoring.
Prometheus Remote Storage
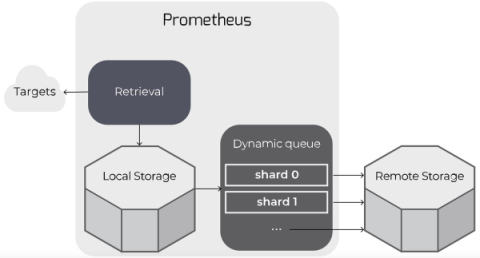
Prometheus can be configured to read from and write to remote storage, in addition to its local time series database. This is intended to support long-term storage of monitoring data.
September Product Updates for Sentry
It’s official, summer is over. So grab yourself a pumpkin-spiced food item of choice and check out what the Sentry team has been up to this past month. From introducing new features, product improvements, and integrations, we can objectively say we made Sentry at least a smidge better this month. Keep reading to see how the latest developments can make your debugging experience less painful.
Future-Proof Your Observability Strategy With CrowdStrike and Cribl
Traditional logging tools are struggling to keep up with the explosive pace of data growth. Data collection isn’t the most straightforward process — so deploying and configuring all the tools necessary to manage this growth is more difficult than ever, and navigating evolving logging and monitoring requirements only adds another layer of complexity to the situation.
Full Stack Observability Guide - Examples and Technologies
As modern software systems become increasingly distributed, interconnected, and complex, ensuring production reliability and performance is becoming harder and more stressful. Seemingly nondescript changes to our infrastructure or application can have massive impacts on system uptime, health, and performance, all while the cost of production incidents continues to grow.


